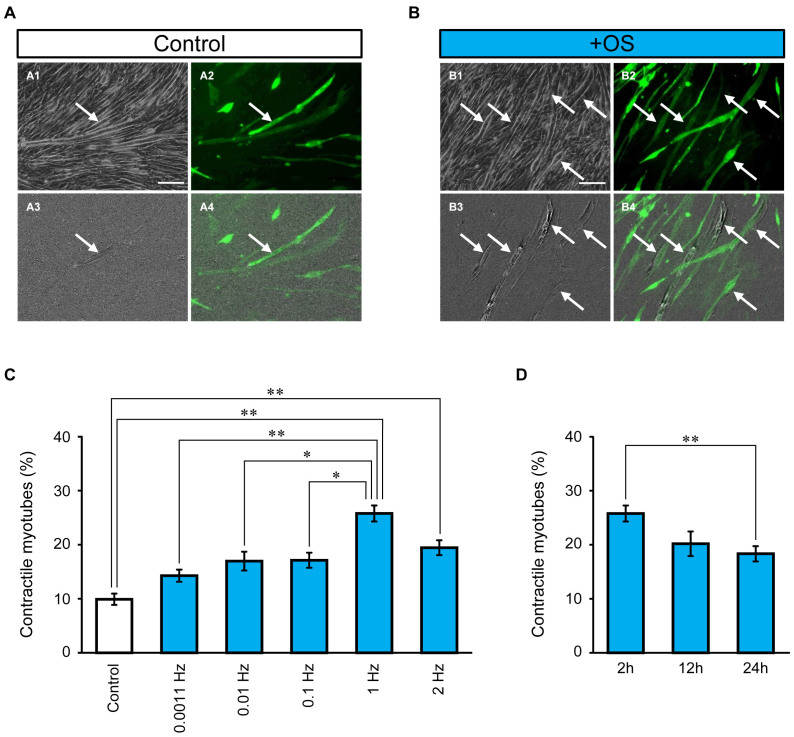
Figure 5. Induction of contractile ability.
(A) Image difference extraction analysis of myotubes without OS training: phase-contrast image (A1), ChRGR-Ve-fluorescence image (A2), difference image (A3), and merged image of A2 and A3 (A4). Contracted myotubes are indicated by arrows. (B) Myotubes after OS training. Scale bar, 100 μm. (C) Effects of OS protocols on the fraction of contractile fluorescent myotubes divided by the total fluorescent myotubes (from left to right): control without OS (n = 24 regions), 0.0011 Hz (n = 20 regions), 0.01 Hz (n = 20 regions), 0.1 Hz (n = 28 regions), 1 Hz (n = 32 regions), and 2 Hz (n = 16 regions). (D) Fraction of contractile myotubes with OS protocols at 1 Hz for (from left to right): 2 h (n = 32 regions), 12 h (n = 12 regions), and 24 h (n = 16 regions). Each experiment consists of at least four independent replicates. *, P < 0.05; **, P < 0.01; Kruskal–Wallis test.

