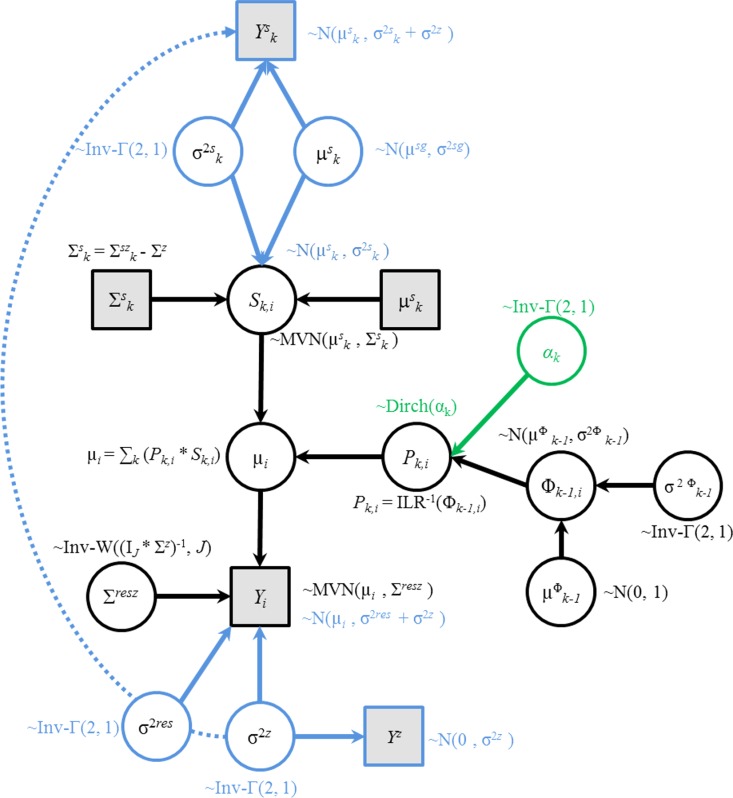
Figure 1.

A Directed Acyclic Graph (DAG) of the benchmark Bayesian mixing model (M1) in black, with extension to the Dirichlet distribution parameterization in green (M11) and the full Bayesian model (M12) in blue. Gray squares indicate nodes with observed data, whilst white circles indicate random variables estimated by the Markov Chain Monte Carlo (MCMC) procedure. Prior distributions and deterministic link equations are noted alongside. See text for symbol meanings.
