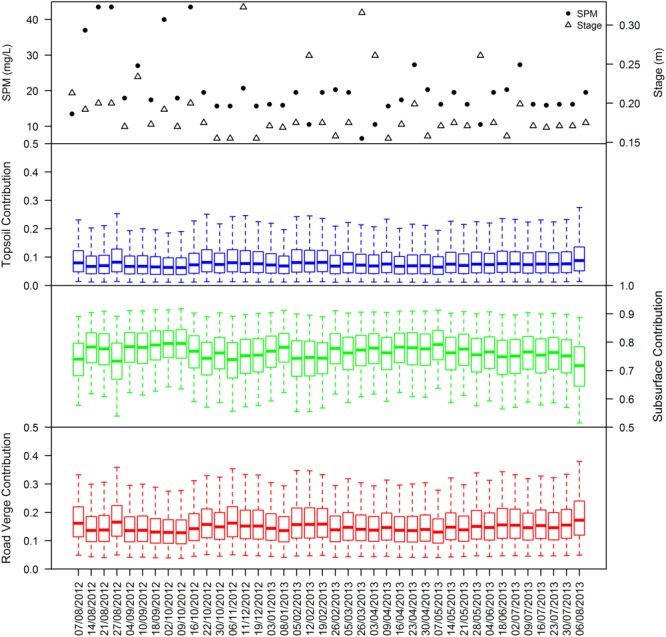
Figure 4.

Benchmark model (M1) source apportionment estimates under base flow conditions for the period August 2012 to August 2013. The solid central line, boxes, and whiskers represent the median, 50% and 95% Bayesian credible intervals, respectively.
