Figure 6.

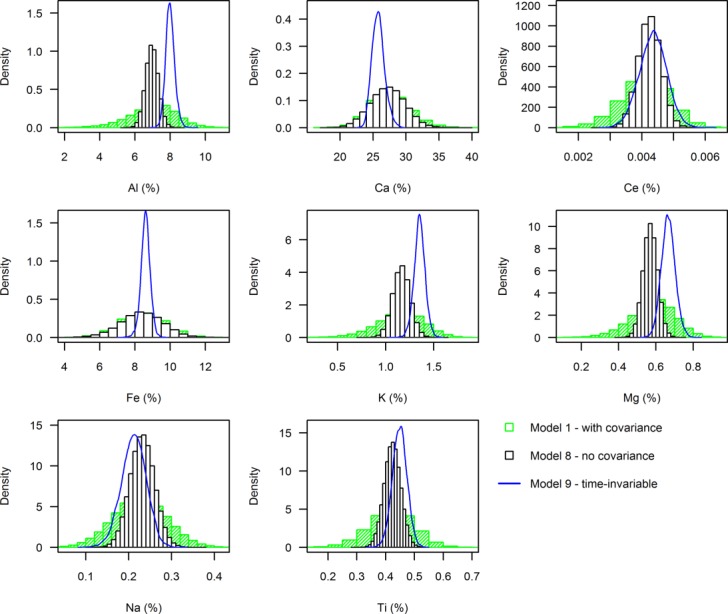
Histograms of the combined posterior subsurface source fingerprint concentrations for all 40 model time steps. Shown for models run with (M1) and without (M8) covariance terms, and with time-invariable source distributions (M9).

Histograms of the combined posterior subsurface source fingerprint concentrations for all 40 model time steps. Shown for models run with (M1) and without (M8) covariance terms, and with time-invariable source distributions (M9).