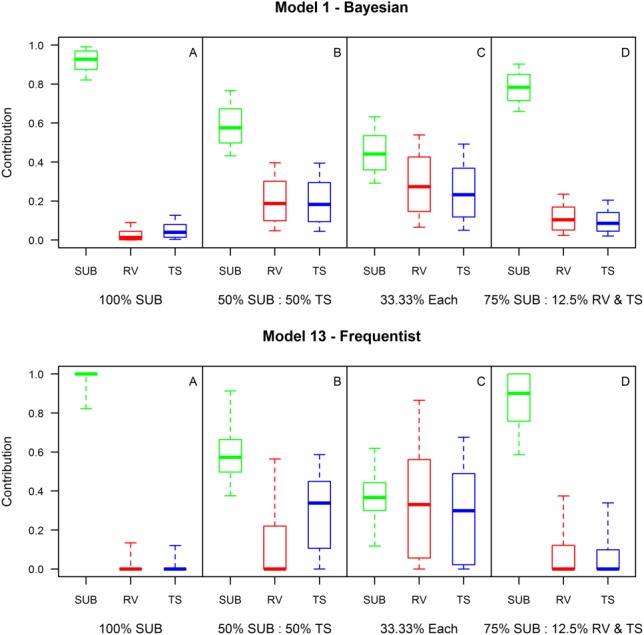
Figure 8.

Comparing how Bayesian (M1) and frequentist (M13) mixing models perform in identifying sediment samples derived from (a) 100% subsurface sediment, (b) a 50:50 subsurface-topsoil mix, (c) a 33.33% mix of all three sources, and (d) a 75% subsurface, 12.5% road verge, 12.5% topsoil mix. The solid central line, boxes, and whiskers represent the median, 50%, and 95% credible intervals, respectively.
