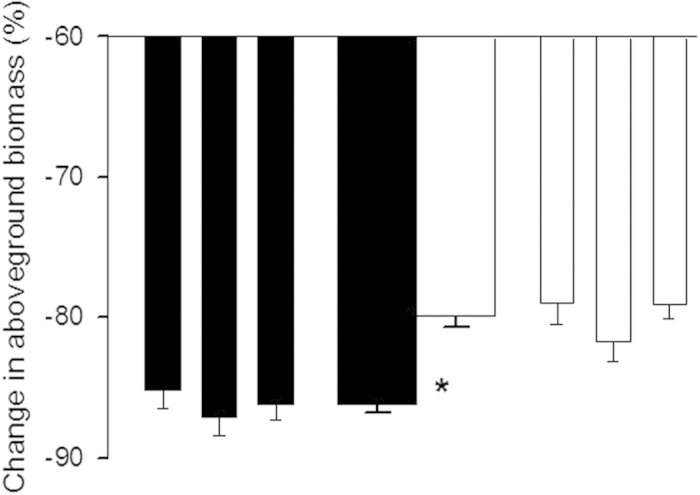
Figure 3.

Changes in aboveground biomass of Ageratina adenophora plants from the native (closed bars) and invasive (open bars) populations when grown in artificial communities with high density. Narrow bars indicate means and SE for each population; two thicker bars in the center depict means and SE for each range. * indicates significant differences between ranges (P < 0.05) (one-way nested ANOVAs).
