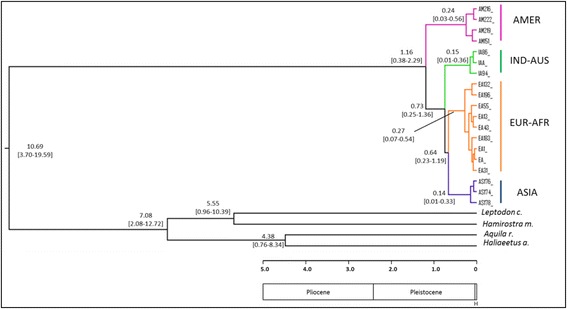
Fig. 5.

Chronogram obtained with BEAST 1.8.0 showing the time of divergence for the diverse splits in Pandion haliaetus using a substitution rate of 0.01973 ± 0.005 per lineage per million years. Values between brackets at nodes indicate 95 % highest posterior densities. The colour code used for each haplogroup is the same as in previous figures. A partial geological time scale is reported below the chronogram (H = Holocene)
