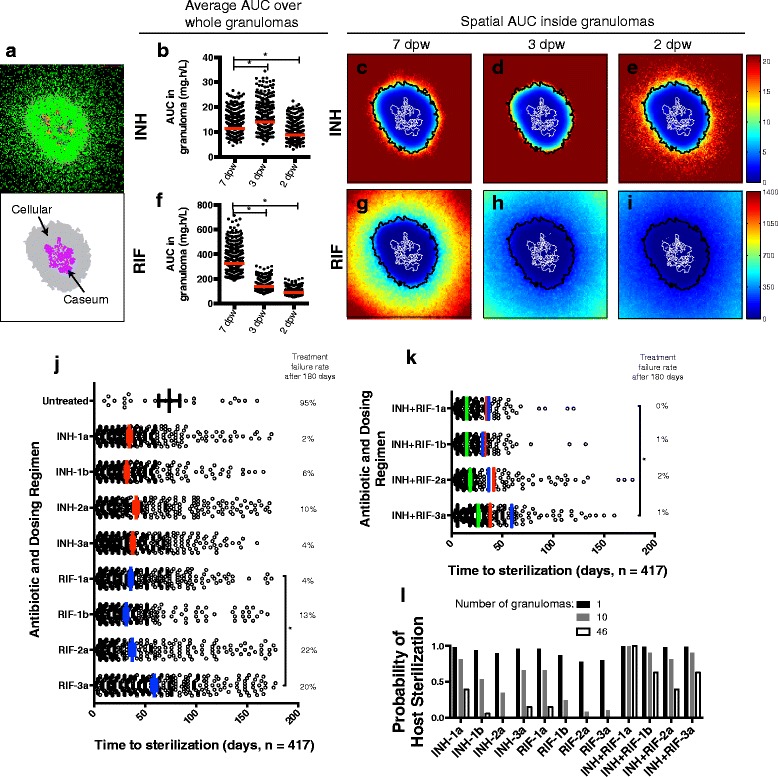
Fig. 3.

Antibiotic distribution, cumulative exposure (AUC) and treatment outcomes in simulated granulomas. a Simulated granuloma snapshot at 100 d.p.i. with cellular (gray) and caseated (purple) areas indicated. Snapshot shows resting (green), activated (blue), and infected (orange and red) macrophages; extracellular bacteria (brown); T cells (purple, pink and light blue). b INH 7 day AUC (mg.h/L) averaged over entire granulomas for all simulated granulomas (N = 417). c-e INH 7 day AUC as a function of position in the granuloma in panel (a). AUCs are calculated over the first week of treatment with three dosing regimens: 7 doses per week, 3 doses per week, and 2 doses per week. f-i Same as (b-e) but for RIF. Cellular and caseum outlines from (a) are shown in black and white lines respectively in (c-e; g-i). Color bars are scaled from 0 mg.h/L to the AUC EC80 (exposure where 80 % of maximal killing is achieved) for each antibiotic. j Treatment outcomes for single antibiotic therapy. Each circle represents one granuloma sterilized during 180 days of treatment. Bars and errors bars: mean +/− SEM of time to sterilization. Numbers on the right show treatment failure rates. k Treatment outcomes for combination therapy with INH and RIF. Green bars and errors bars: mean +/− SEM. Red and blue lines indicate means for INH (red) and RIF treated granulomas (blue) from (j). l Probability of a host with 1, 10 or 46 granulomas sterilizing all granulomas during 6 months of treatment. *: p < 0.0001 (one way ANOVA with Sidak multiple comparison correction)
