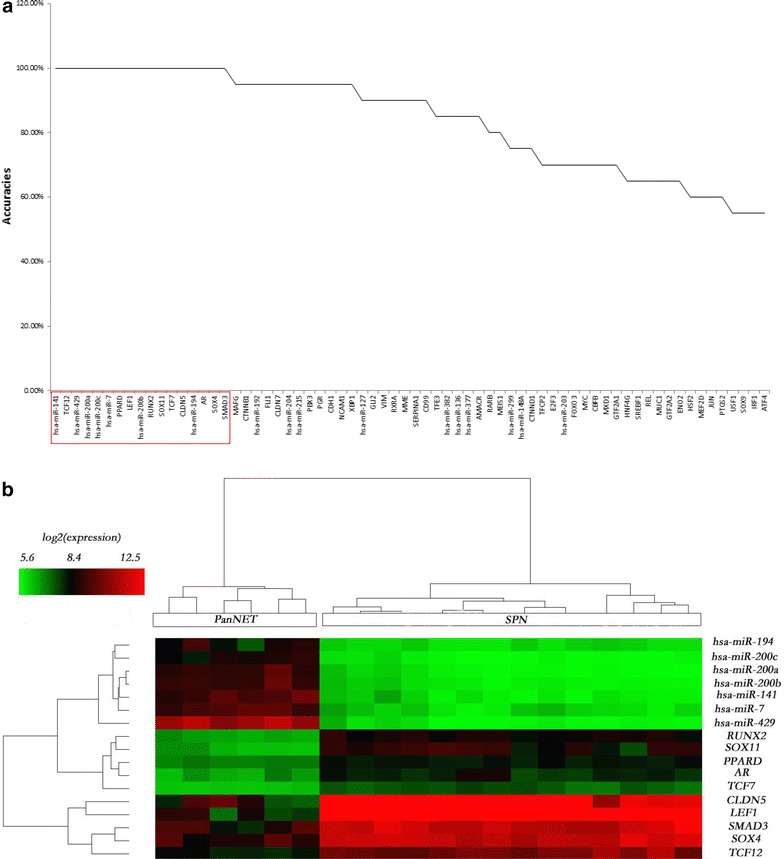
Fig. 6.

Biomarkers for SPN versus PanNET/PDAC. a Plot of the KNN classification accuracy for 69 genes independently in differentiating SPN from PanNET. b Heatmap of expression profiles of biomarkers for SPN and PanNET. Rows correspond to genes and columns correspond to samples, color bar gradient represents log2 expression
