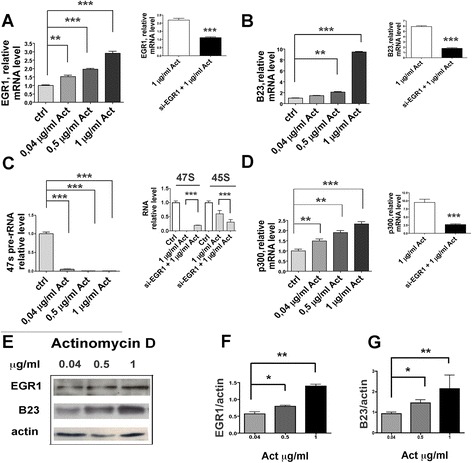
Fig. 2.

Actinomycin D induces EGR1 and B23. Relative mRNA levels of EGR1, B23, 47S,45S pre-rRNA and p300 (the last two are known gene targets of EGR1) expressed in HeLa cells treated with Actinomycin D for 1 h at 37 ° C (Panel a to d). The smaller inserts in the panels compare the effect of siRNA EGR1 plus Actinomycin D to that of Actinomycin D alone. Quantitative evaluation of EGR1 and B23 proteins under the effect of Actinomycin D, together with a representative immunoblot, are shown in Panel e to g. Data are the mean +/− s.e. of three independent experiments. Comparisons were performed by one way ANOVA. Significant results are highlighted with asterisks (*p < 0.05; **p < 0.01; ***p < 0.001)
