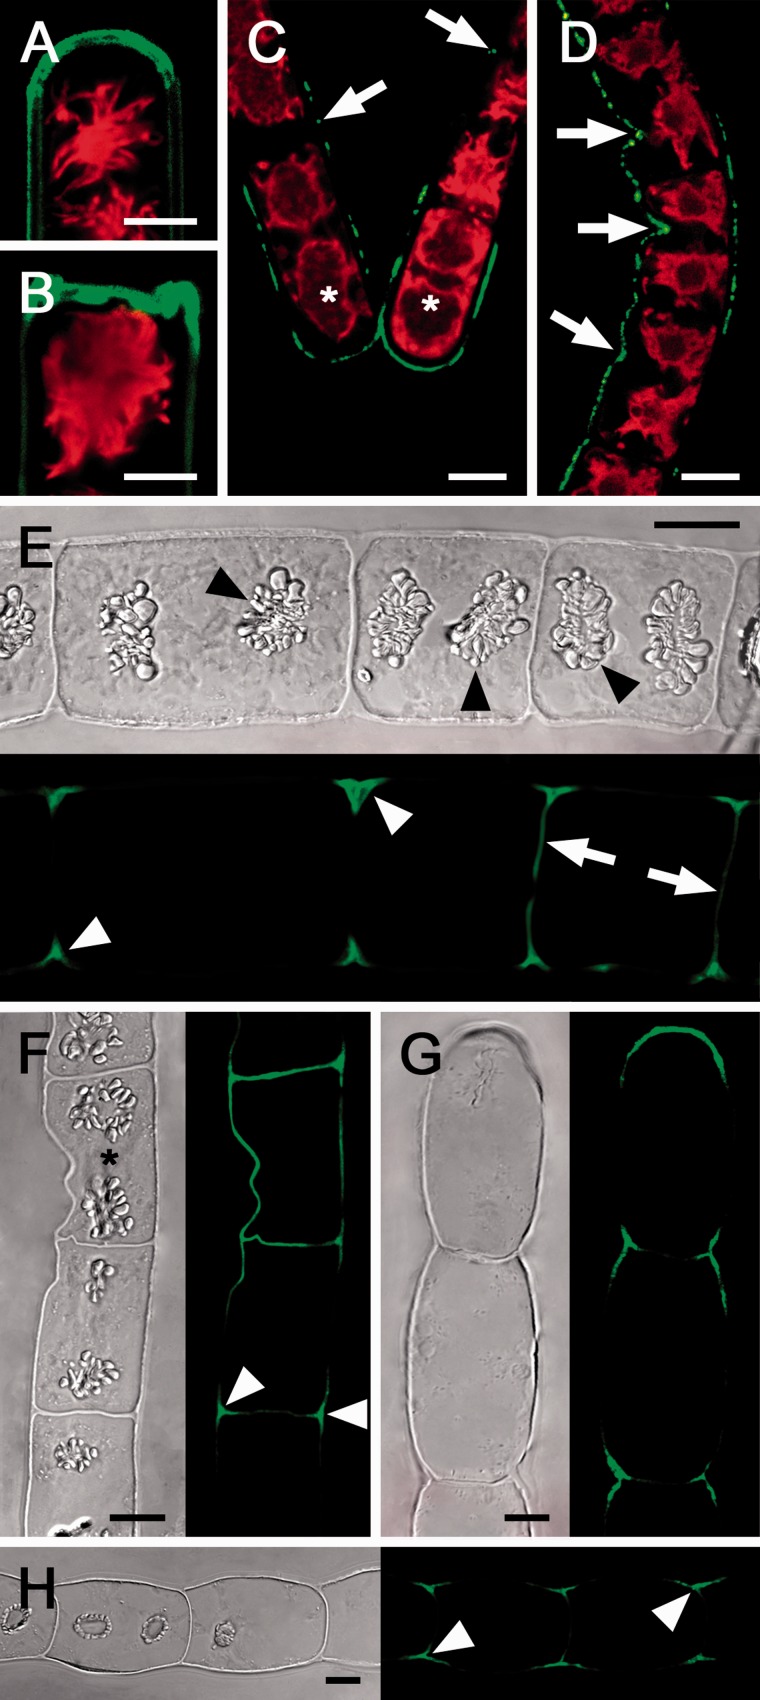
Fig. 4.
Micrographs of Zygnema S (A, B, E, G) and Zygnema E-A (C, D, F, H); hydrated cells (A–F), 210 min desiccated cells (G, H). (A–D) Live cell labeling (red, Chl autofluorescence); (E–H) the corresponding bright field image and labeling of semi-thin sections with the monoclonal antibody 400-2 (green). (A) Convex terminal cross wall stained abundantly. (B) Recently fragmented cells with massive staining in the new terminal wall. (C) Detaching filament; a strong signal in the terminal cells (asterisks) and weak labeling in longitudinal walls (arrow). (D) Filament with a deformed longitudinal cell wall abundantly stained (arrow). (E) Filament with clearly visible starch grains in pyrenoids (arrowheads); cell corners show strong labeling; only cross cell walls of young cells are stained (arrow). (F) Filament with a deformed cell (asterisk) and strong callose labeling in the area of deformation and in cell corners (arrowheads). (G) Desiccated filament with labeling restricted to the terminal cell wall and cell corners. (H) Desiccated filament with labeling in cell corners. Scale bar = 10 µm.

