Fig. 5.
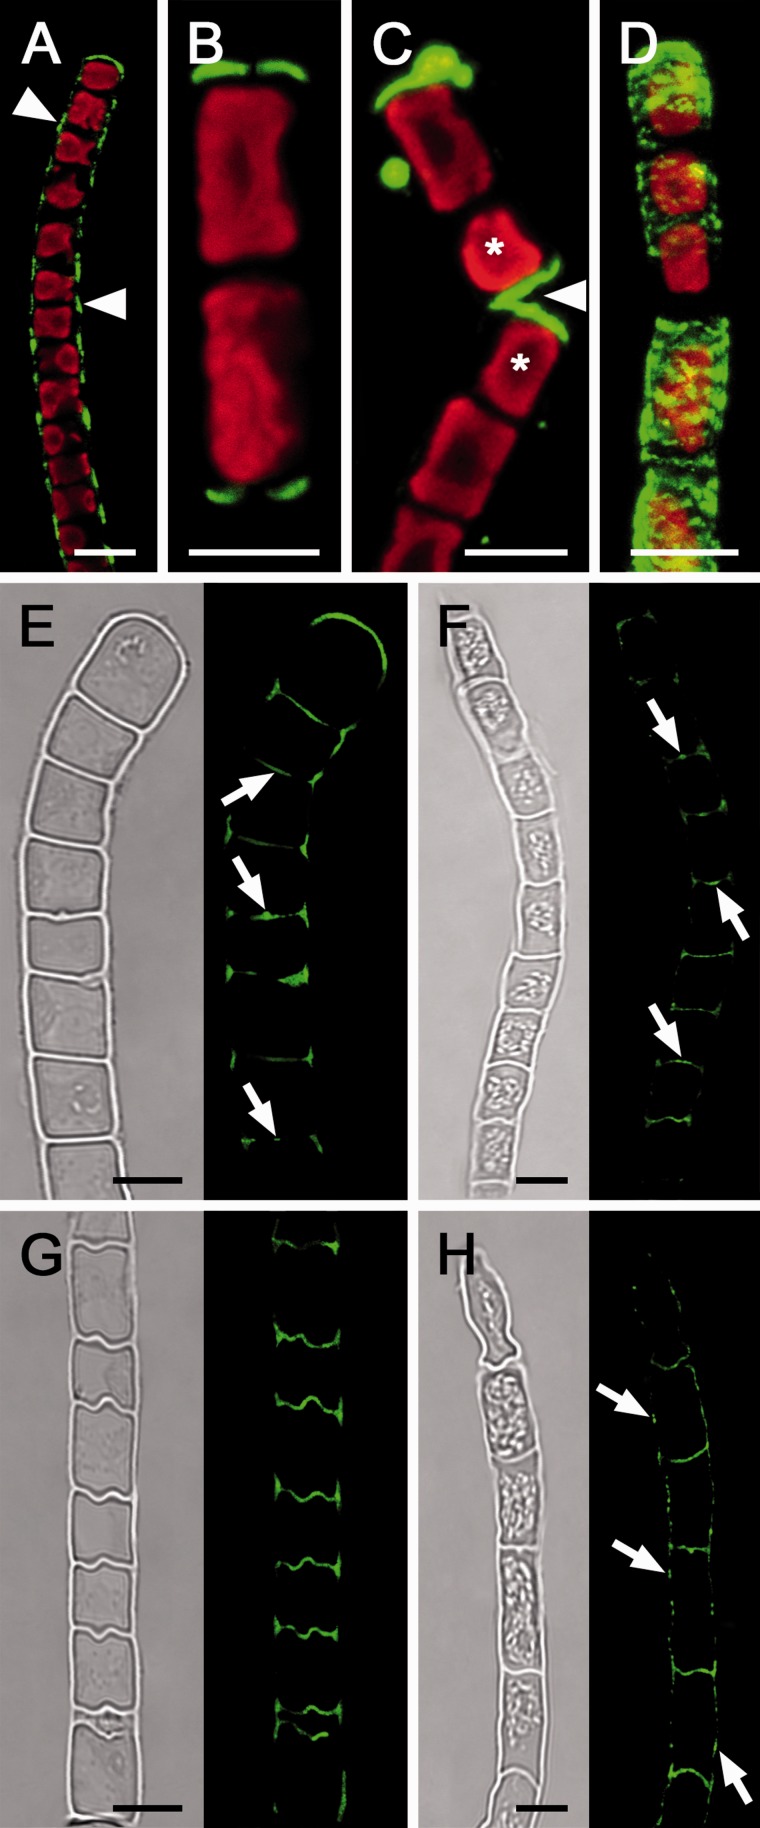
Micrographs of Klebsormidium crenulatum (A, E, G) and Klebsormidium nitens (B, C, D, F, H). (A–D) Live cell labeling (red, Chl autofluorescence), and labeling of sem-ithin sections (E–H) of hydrated (E, F) and desiccated filaments (G, H) with the monoclonal AB 400-2 (green). Bright field image and corresponding labeling is shown. (A) Callose labeling in the longitudinal cell walls between individual cells (arrowheads). (B) Filament fragment with callose labeling in the terminal cross cell walls. (C) Detached cells (asterisks) show labeling in the terminal walls (arrowhead). (D) 3D projection of a deformed cell filament with strong callose labeling. (E) Callose labeling in cross cell walls, with maximal labeling in the center of the cross cell walls and protuberances (arrows). (F) Callose in the center of cross cell walls (arrows). (G) Undulated cross cell walls with abundant callose staining. (H) Callose labeling in cross cell walls and longitudinal walls (arrows). Scale bar = 5 µm.

