
Figure 4. Synchronization diagrams obtained by operating frequency exchanges between connected nodes, as described in the text.
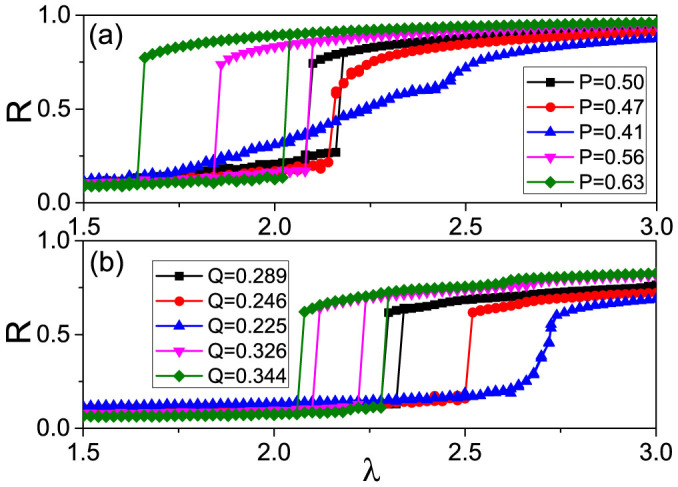
(a) g(ω) taken as a Gaussian distribution with both positive and negative ω, where the “squares” denotes the case of no operation, “circles” and “up triangles” represent the cases of decreasing P to P = 0.47, and 0.41, respectively, and “down triangles” and “diamonds” represent the cases of increasing P to P = 0.56, and 0.63, respectively. (b) g(ω) taken as a Lorentzian distribution with only ω > 0. The “squares” denotes the case of no operation with Q = 0.289, “circles” and “up triangles” represent the cases of decreasing Q to Q = 0.246, and 0.225, respectively, and “down triangles” and “diamonds” represent the cases of increasing Q to Q = 0.326, and 0.344, respectively.