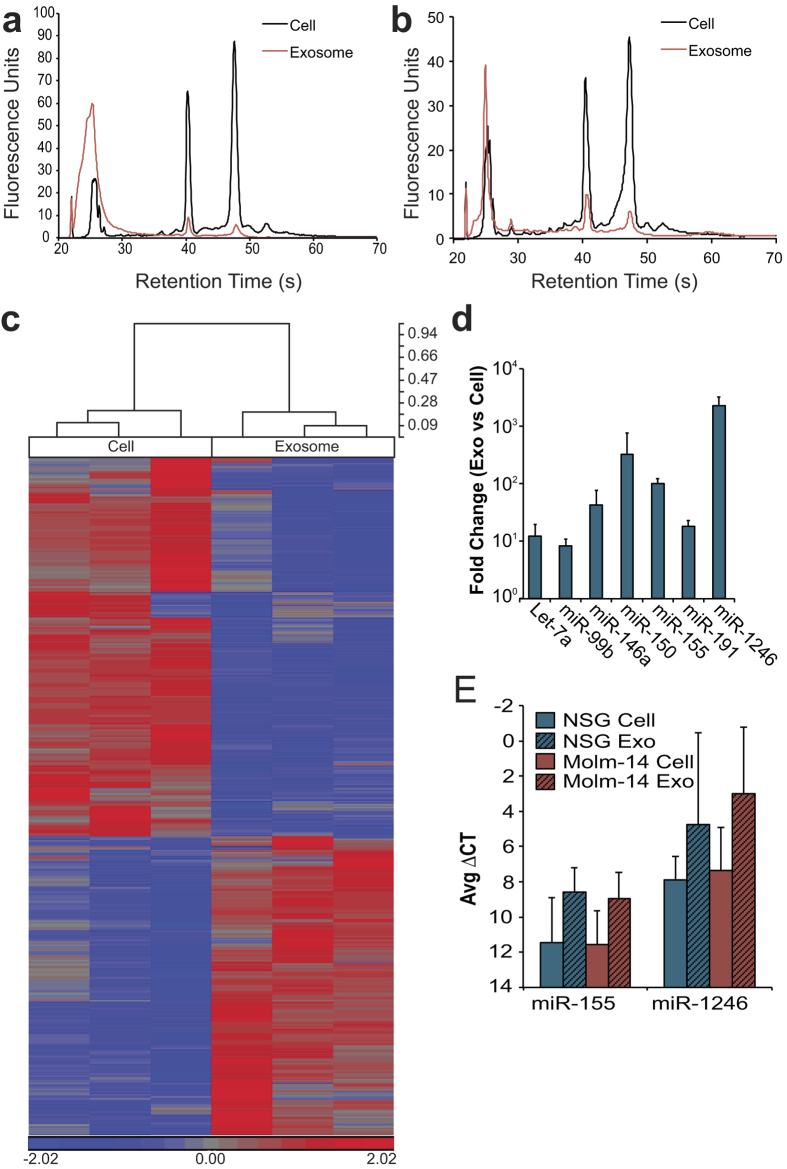
Figure 2. Molm-14 and Stromal Exosomes Concentrate Selected MicroRNA.
(a,b) RNA size profiles of exosomes. RNA was collected from Molm-14 (a) and NSG Stromal (b) cells and their exosomes after 72 hours in culture, and miRNA was evaluated using a bioanalyzer. (c) Microarray comparison of cell, exosome miRNA. Molm-14 cell and exosome microRNA was evaluated using an Affymetrix microRNA microarray. All targets with more than 2-fold mean difference between producing cell and exosome are represented, RMA-corrected and standardized to a mean of 0 and a SD of 1. Dendrogram values are 1 - Pearson’s R. (d,e) qRT-PCR for miRNA in cells versus exosomes. Selected targets from NSG stromal (d) and Molm-14 (e) cells and exosomes were validated using Taqman qRT-PCR, normalized to U6 snRNA. Fold change was calculated by 2^-ΔΔCt.

