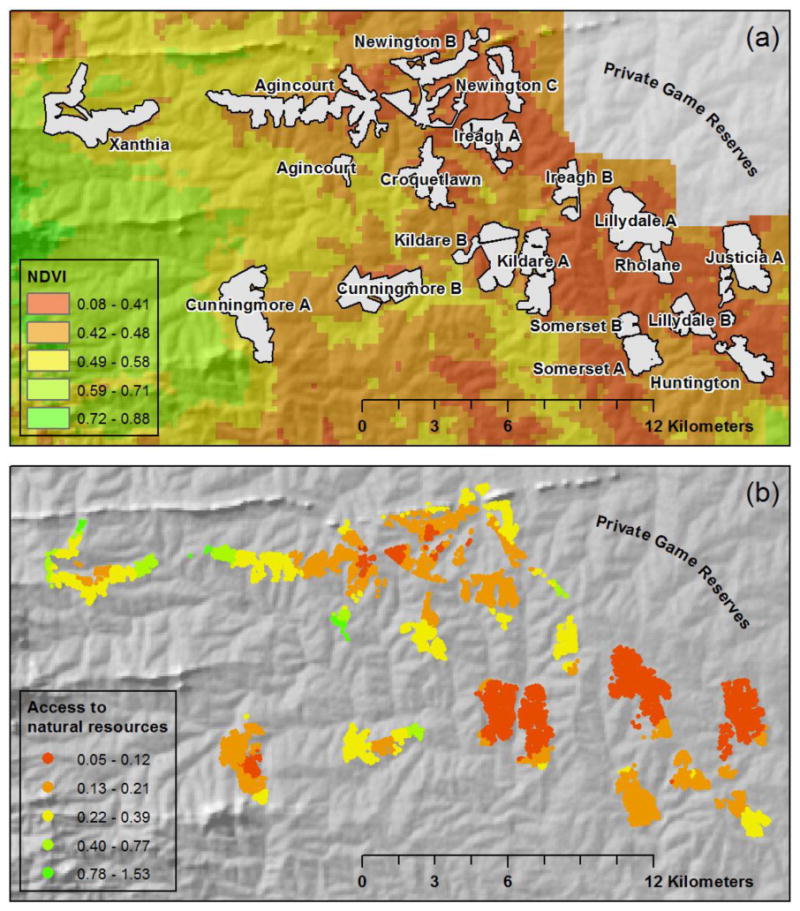
Figure 2. Mean NDVI values averaged across the 3 year period leading up to the year 2004 for the Agincourt study site.

Note: Panel (a) shows the average NDVI values (2002-2004) for the study region; Panel (b) shows the population weighted access to natural capital per household. Topography is visualized using a digital elevation model (DEM).
