Figure 5.

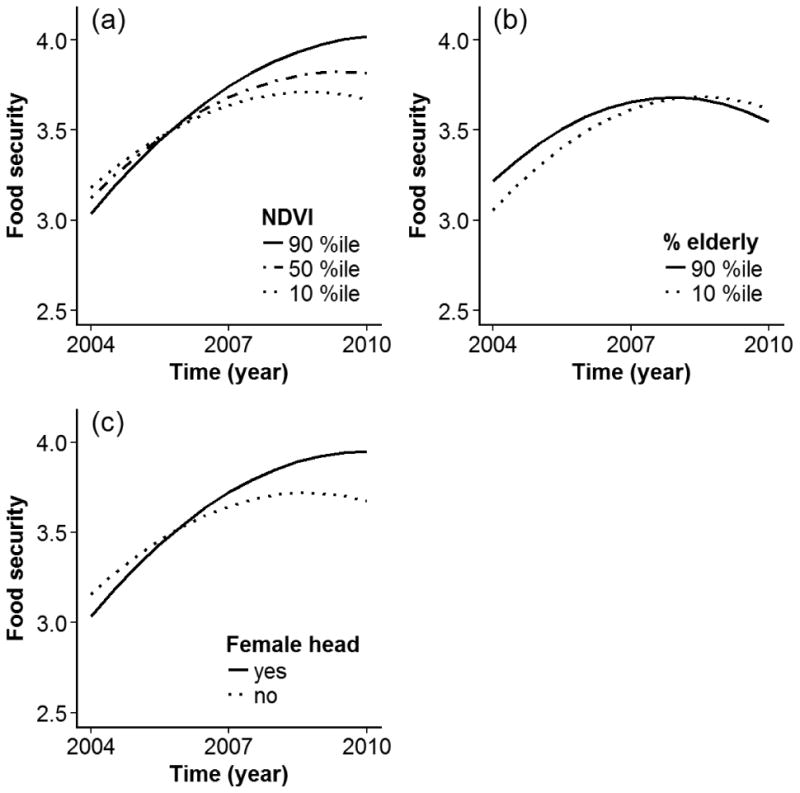
Visualization of variation in food security trajectories for different sub populations defined by access to natural resources (a), percentage of elderly in the household (b), and gender of the household head (c)

Visualization of variation in food security trajectories for different sub populations defined by access to natural resources (a), percentage of elderly in the household (b), and gender of the household head (c)