Fig. 2.

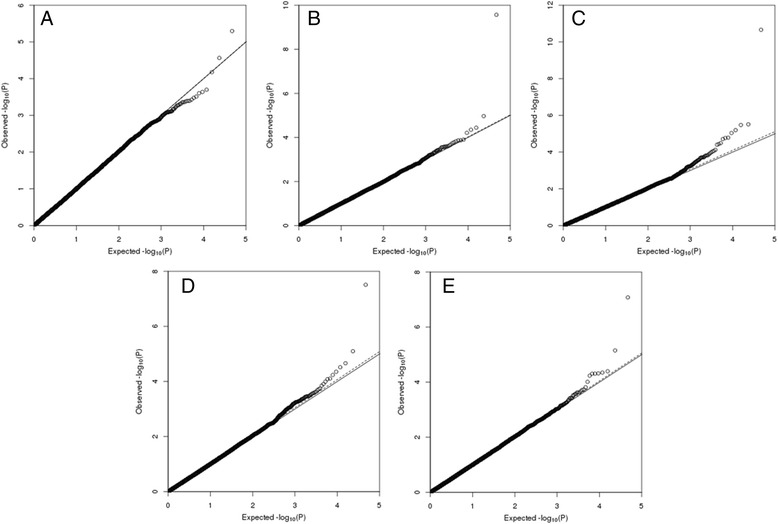
Quantile-quantile plot for dag score at three (a) and eight months (b), faecal egg count in summer (c), autumn (d) and as adult (e). The 0–1 line (solid) and the slope (dash) are also plotted

Quantile-quantile plot for dag score at three (a) and eight months (b), faecal egg count in summer (c), autumn (d) and as adult (e). The 0–1 line (solid) and the slope (dash) are also plotted