Fig. 3.

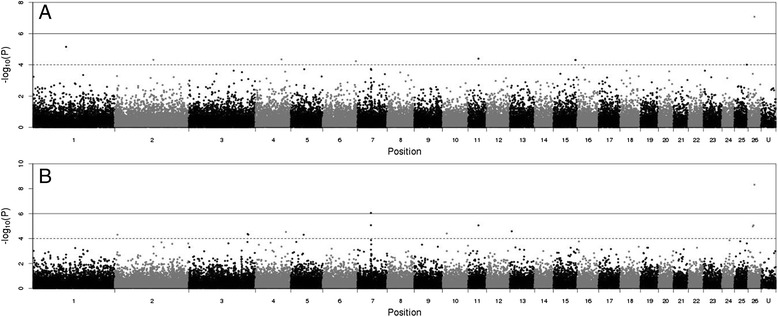
Manhatten plot of -log10(P) values of SNPs for dag score at eight months (a) and faecal egg count in summer (b). Ordered on the ovine genome v3 map, P < 0.0001 (solid line), P < 0.001 (dash line)

Manhatten plot of -log10(P) values of SNPs for dag score at eight months (a) and faecal egg count in summer (b). Ordered on the ovine genome v3 map, P < 0.0001 (solid line), P < 0.001 (dash line)