Fig. 4.

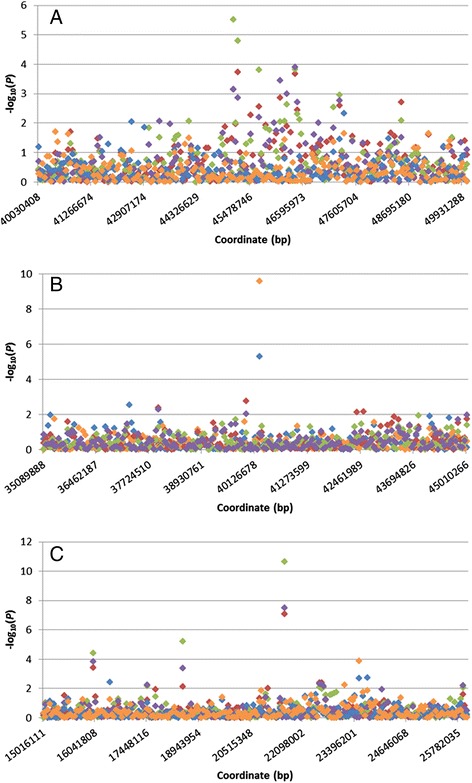
Distribution of -log10(P) values for dag score at three (blue) and eight months (orange) and faecal egg count in summer (green), autumn (purple) and as adult (red) for candidate regions on OAR 7 (a), 15 (b) and 26 (c)

Distribution of -log10(P) values for dag score at three (blue) and eight months (orange) and faecal egg count in summer (green), autumn (purple) and as adult (red) for candidate regions on OAR 7 (a), 15 (b) and 26 (c)