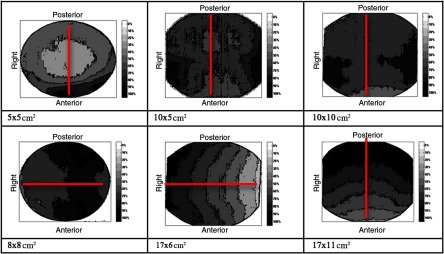
Fig. 10.
Axial dose distribution for different FOVs. The dose distribution was obtained just for average adult and child settings. The red line represented the measuring diameter for DI1. The bottom and left side of the dose distribution correspond to the anterior and right side of the patient. The scale bar shows the distribution of dose as a percentage of maximum dose in each image.

