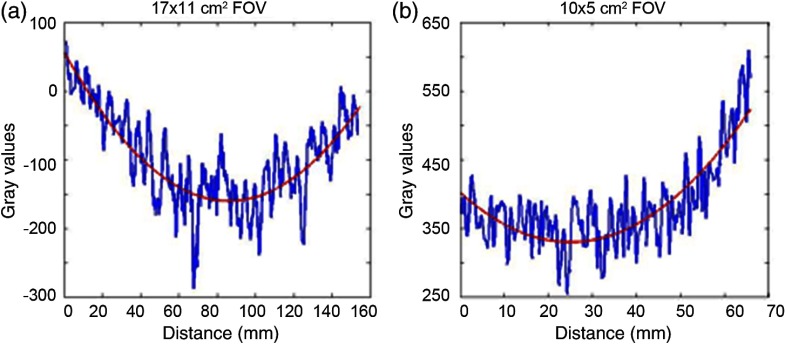
Fig. 7.
The uniformity graphs including the noise in the image, which is not representing the actual noise in the image since it was smoothed for illustration purposes. (a) Uniformity profile at center of image representing symmetrical uniformity cupping at middle as an example for (shown) and FOVs. (b) Uniformity profile at center of image is showing asymmetrical cupping uniformity at middle of image for , , , and (shown) FOVs.

