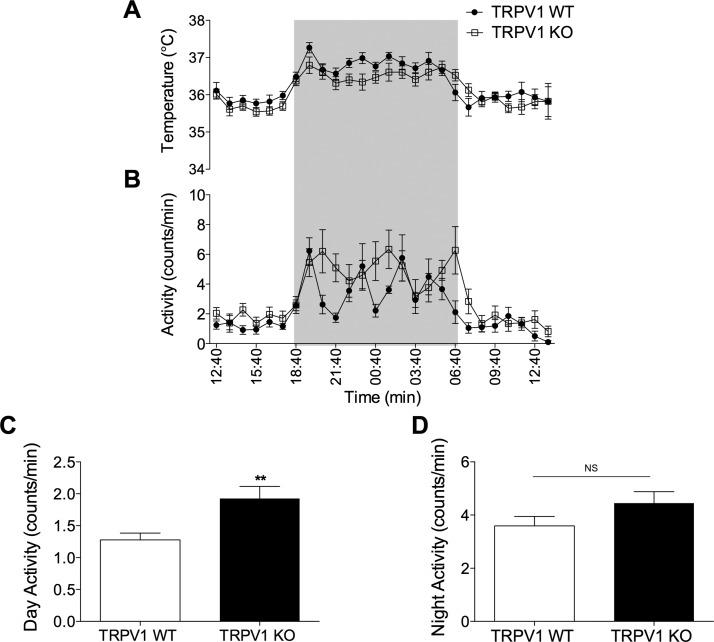
Figure 5.
Core body temperature and activity profile of TRPV1 KO mice. Normal circadian rhythm of temperature (A) and activity (B) of TRPV1 WT mice (closed circles) and TRPV1 KO mice (open squares) over 24 h using radio-telemetry (n = 9). Shaded areas in (A) and (B) denote the dark phase. Average 12-h light-phase activity levels (C) and average 12-h dark-phase activity levels (D), measured in TRPV1 WT and KO mice (n = 9). Results are means ± sem. **P < 0.01 vs. WT using 2-tailed Student’s t test; NS, not significant.

