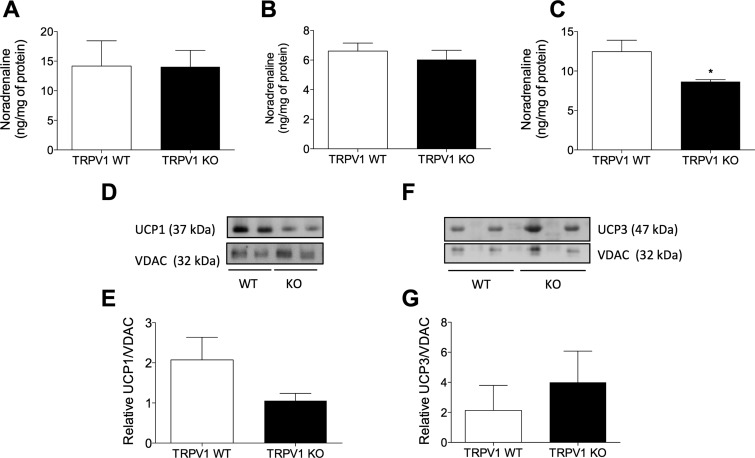
Figure 7.
Suppressed sympathetic activity in TRPV1 KO mice. NA concentrations measured in brain (A), BAT (B), and skin (C) samples of TRPV1 WT and KO mice (n = 7–8). D) Immunoblot of UCP1 and loading control VDAC in BAT mitochondrial protein of TRPV1 WT and KO mice. E) Densitometric analysis of the relative expression of UCP1/VDAC (n = 5–6). F) Immunoblot of UCP3 and loading control VDAC in skeletal muscle mitochondrial protein of TRPV1 WT and KO mice. G) Densitometric analysis of the relative expression of UCP3/VDAC (n = 5–6). Results are means ± sem. *P < 0.05 vs. WT using 2-tailed Student’s t test.

