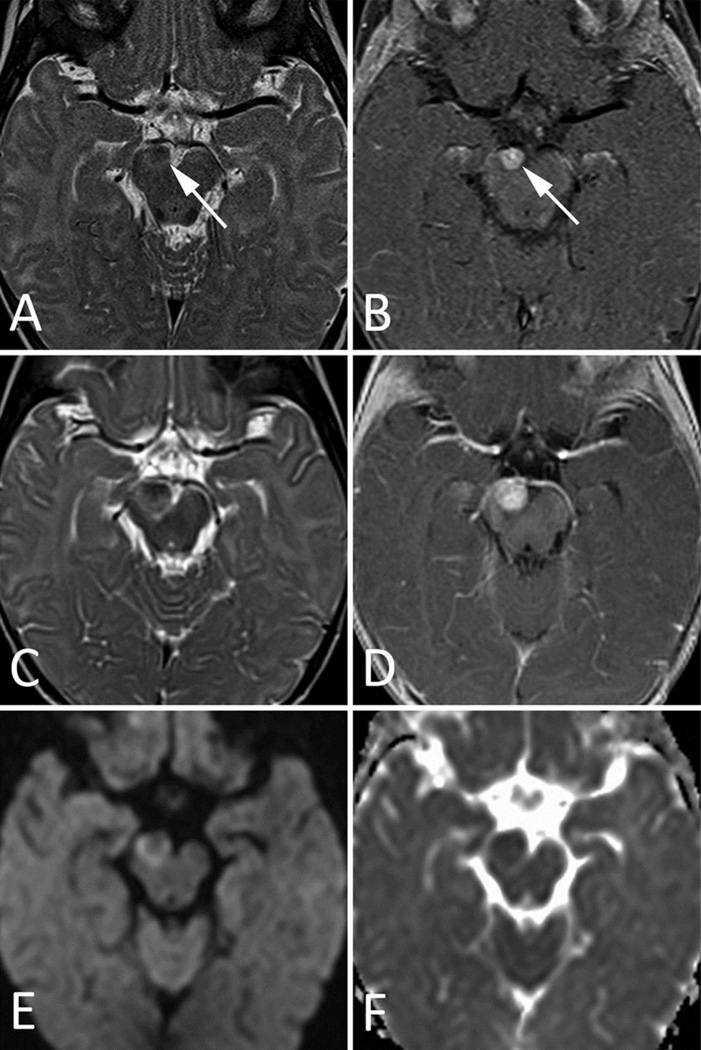
Fig 1. MRI Images of Patient 1.
A–B. Initial MRI at presentation. a. Axial T2-weighted image through the level of the midbrain shows a small, solid, iso- to hypo-intense mass (arrow) at the expected location of the CN III origin in the anteromedial aspect of the right cerebral peduncle. b. Initial MRI at presentation. Axial postcontrast T1-weighted image shows slightly heterogenous but avid enhancement of the lesion (arrow).
C–F. Follow-up MRI 1 month after presentation. c. Axial T2-weighted image shows interval growth of the mass. Note the increased mass effect on the right P2 segment of the PCA, which lies anterior to the mass. d. Axial postcontrast T1-weighted image clearly demonstrates interval increase in the size of the tumor. e. Axial DWI shows a relative increase in signal around the periphery of the lesion, with relative iso-intensity towards the center of the mass. f. Axial ADC map shows slightly decreased signal within the mass, confirming restricted water diffusion and suggesting internal hypercellularity.

