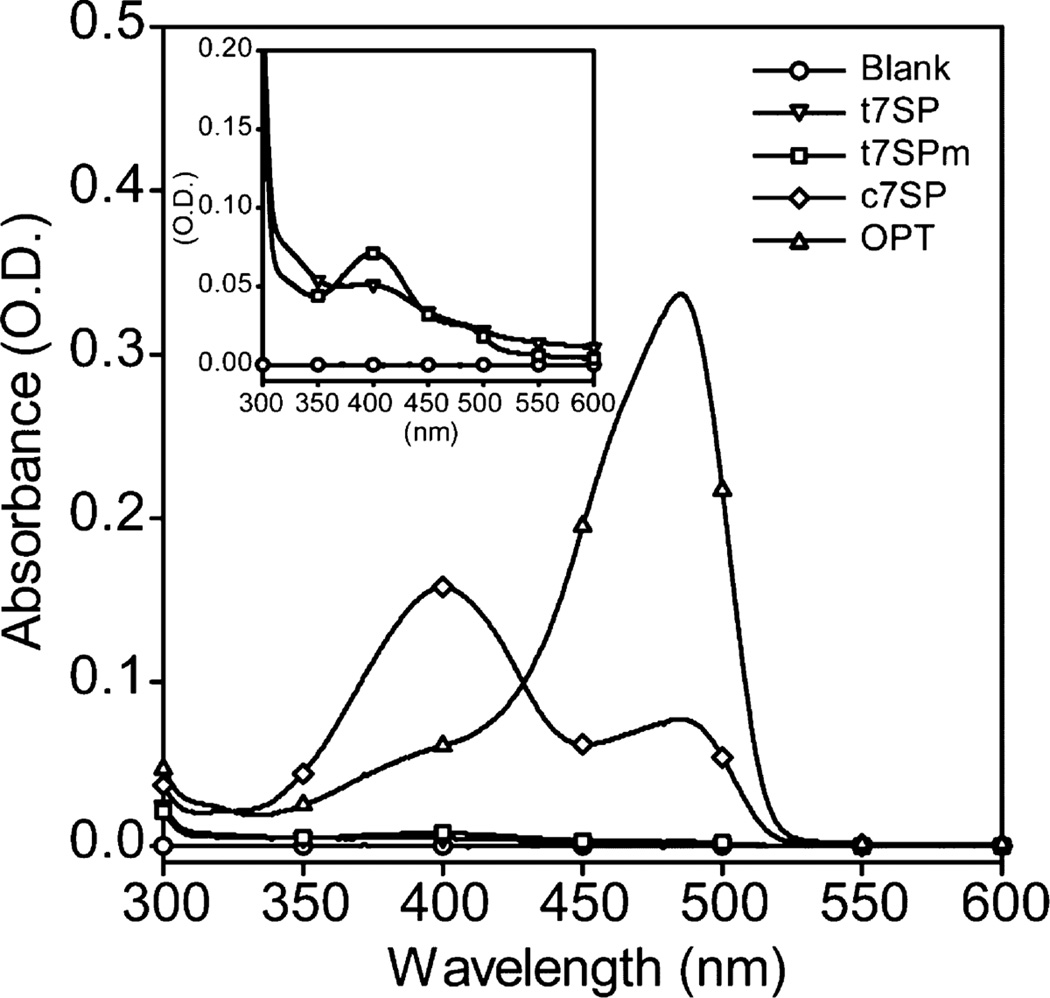
Figure 2.
UV–visible spectra of native GFP variants. Purified t7SP, t7SPm, OPT, and c7SP were diluted to 10 µM in TN buffer (pH 7.5), and absorbance spectra between 300 and 600 nm were recorded. The UV–visible spectra of t7SP and t7SPm were also measured with a protein concentration of 80 µM to increase the absorbance signal (inset).

