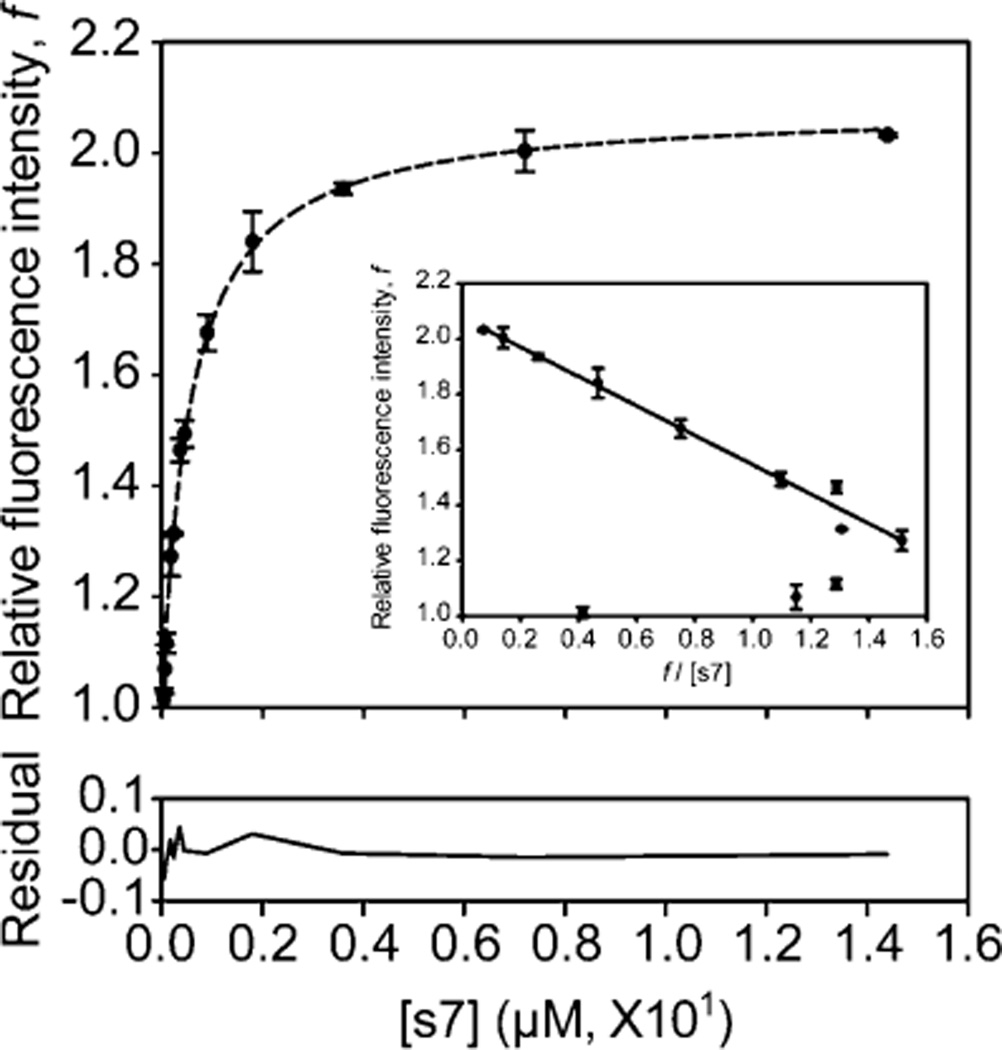
Figure 7.
Concentration-dependent fluorescence recovery of the leave-one-out GFP. The in vitro complementation assays were performed with 0.1 µM t7SPm and with variable concentrations of the s7 peptide ligand under native conditions. The fluorescence intensity at 508 nm emission upon complementation was recorded every 5 s for 20 min with excitation at 485 nm at room temperature, and the normalized fluorescence (F/F0) was plotted as the relative fluorescence intensity, f (Figure 4 of the Supporting Information). Different molar ratios of t7SPm to the s7 peptide ligand (>95% pure) covering a >100-fold range from 1:0.36 to 1:144 were tested, and the average of relative fluorescence intensity f (n = 2) at the end point (i.e., 1200 s after the initiation of complementation) was plotted and fitted to the one-site binding equation (dashed line) using SigmaPlot to evaluate the dissociation constant (Kd). The residual of the fitting was provided. Relative fluorescence intensity f and f/[s7] were also plotted (inset) and fitted to the linear regression using SigmaPlot (solid line) after excluding three outliers. Error bars indicate the two standard deviations obtained from two independent measurements.

