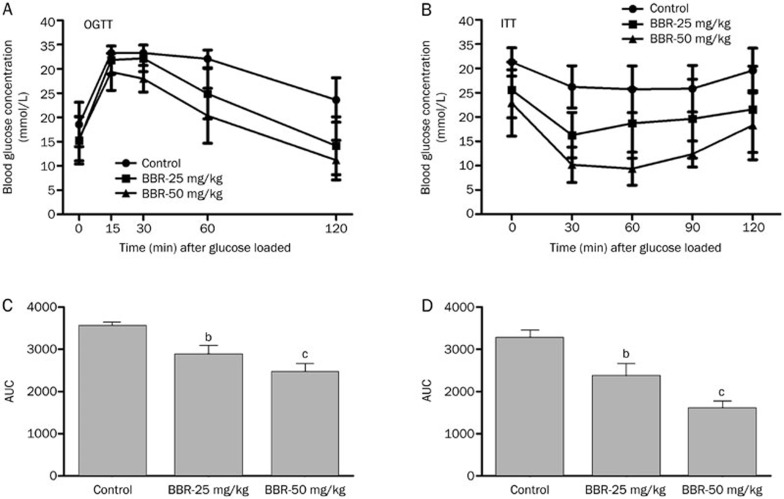
Figure 2.
Effects of 4 weeks treatment of BBR on OGTT and ITT in db/db mice. (A) After po loaded with 2 g dextrose per kg body weight at 0 min, blood glucose concentrations of the mice were measured at the indicated times in the graph. (B) Blood glucose concentrations at the indicated time were measured after ip injection of 1 unit insulin per kg body weight in db/db mice. (C, D) Area under the curve (AUC) for OGTT (C) and ITT (D). Values are mean±SEM (n=8). bP<0.05, cP<0.01 indicate significant differences compared with vehicle group.

