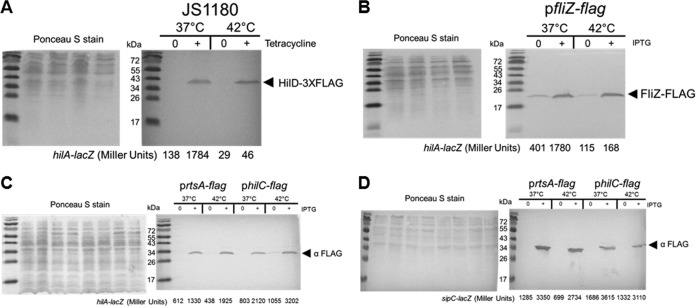
FIG 6.
Overexpression of either the HilD or the FliZ SPI-1 activator does not activate SPI-1 at 42°C, but overexpression of either HilC or RtsA does. (A) Expression of a hilA-lacZ fusion at the chromosomal att site was determined following overnight growth with or without induction of the HilD-3×FLAG protein. Bacteria were grown as described for Fig. 1B, except that samples were diluted 500-fold and cultivated at either 37°C or 42°C. A portion of each sample was removed to measure β-galactosidase activity, and the remainder was treated for SDS-PAGE and Western blotting to detect the FLAG epitope. Following transfer of proteins to the nitrocellulose membrane, the membrane was stained with Ponceau S to ensure the equivalent levels of protein were loaded for samples and that ∼2 × 10⁸ cells were loaded per lane (left panel). Tetracycline was added to reach a concentration of 2.5 μg/ml to induce HilD-3×FLAG. Western blotting with the anti-FLAG antibody revealed cross-reactivity to the HilD protein of the expected size, indicated by the arrowhead with the appropriate label (right panel). The β-galactosidase activity for each sample is listed below each lane (right panel). Samples shown are representative of the results of 3 separate experiments. The complete β-galactosidase activity data are listed here. For JS1180, the values measured at 37°C were 133 ± 13 under uninduced conditions and 1,716 ± 146 under induced conditions and the values measured at 42°C were 28 ± 1 under uninduced conditions and 62 ± 34 under induced conditions. (B) Expression of a hilA-lacZ fusion at the chromosomal att site was determined following overnight growth with or without induction of FliZ-FLAG. Samples were prepared as described for panel A for the Ponceau S staining (left panel), and the Western blot analysis was performed with anti-FLAG (right panel). IPTG was used at 0.1 mM to induce FliZ-FLAG. Sample data shown are representative of the results of 3 separate experiments. The complete β-galactosidase activity data for BTNC0018 (pfliZ-flag) are listed here; the values measured at 37°C were 527 ± 133 under uninduced conditions and 1,539 ± 243 under induced conditions, and the values measured at 42°C were 89 ± 36 under uninduced conditions and 177 ± 92 under induced conditions. (C) Samples were treated as described for panel A for the RtsA-FLAG or HilC-FLAG strains containing the hilA-lacZ fusion and induced with 0.1 mM IPTG. Samples data are representative, and the β-galactosidase activity for each sample is shown below each lane. The complete β-galactosidase activity data are listed here. For BTNC0019 (prtsA-flag), the values measured at 37°C were 580 ± 30 under uninduced conditions and 1,490 ± 317 under induced conditions, and the values measured at 42°C were 367 ± 66 under uninduced conditions and 2,177 ± 504 under induced conditions. For BTNC0020 (philC-flag), the values measured at 37°C were 811 ± 9 under uninduced conditions and 1,936 ± 319 under induced conditions, and the values measured at 42°C were 965 ± 113 under uninduced conditions and 3,142 ± 649 under induced conditions. (D) Strain RM5385 was transformed with prtsA-flag or philC-flag and reporter activity was determined at different temperatures. IPTG was used at 0.01 mM to induce RtsA-FLAG and HilC-FLAG. The Ponceau S (left panel) and Western blotting (right panel) are shown. The complete β-galactosidase activity data are listed here. For BTNC0023 (prtsA-flag), the values measured at 37°C were 1,966 ± 781 under uninduced conditions and 3,409 ± 103 under induced conditions, and the values measured at 42°C were 712 ± 469 under uninduced conditions and 2,666 ± 171 under induced conditions. For BTNC0024 (philC-flag), the values measured at 37°C were 2,801 ± 769 under uninduced conditions and 3,727 ± 906 under induced conditions, and the values measured at 42°C were 1,774 ± 521 under uninduced conditions and 3,122 ± 790 under induced conditions.

