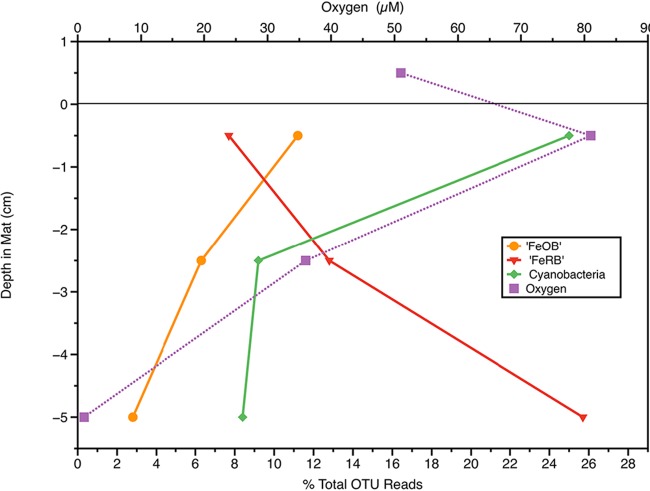
FIG 4.
Low-resolution depth profile in an iron mat from the Kuparuk River iron seep showing the relative percentage of reads for representative groups of bacteria and the O2 concentrations at different depths. The y axis shows depth relative to the mat surface; the air-water interface was about 8 cm above the mat surface. The FeOB and FeRB are inferred based on phylogenetic relationships to groups associated with the respective function. The black horizontal line represents the surface of the mat.

