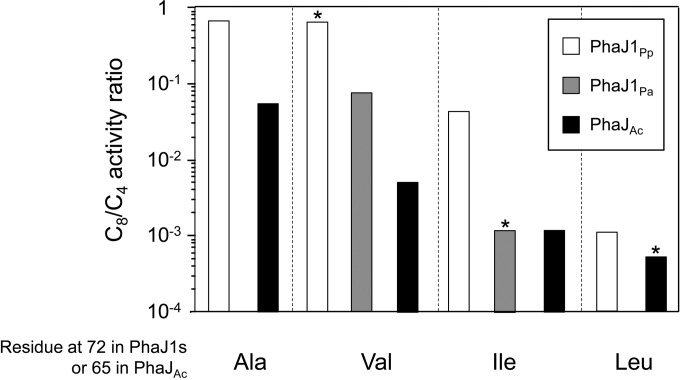
FIG 5.
Comparison of C8/C4 activity ratios. Activity ratios are represented as white bars for PhaJ1Pp and its mutants, gray bars for PhaJ1Pa and its mutant, and black bars for PhaJAc and its mutants. Wild-type enzymes are indicated by an asterisk. Data for PhaJAc and its mutants were retrieved from reference 16.

