Figure 1.
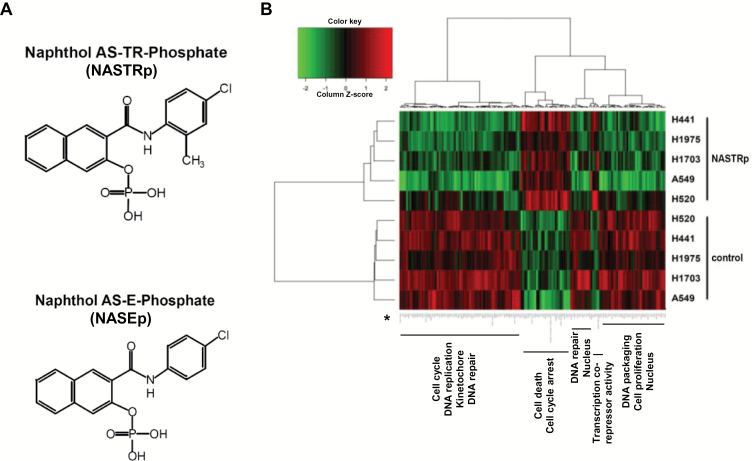
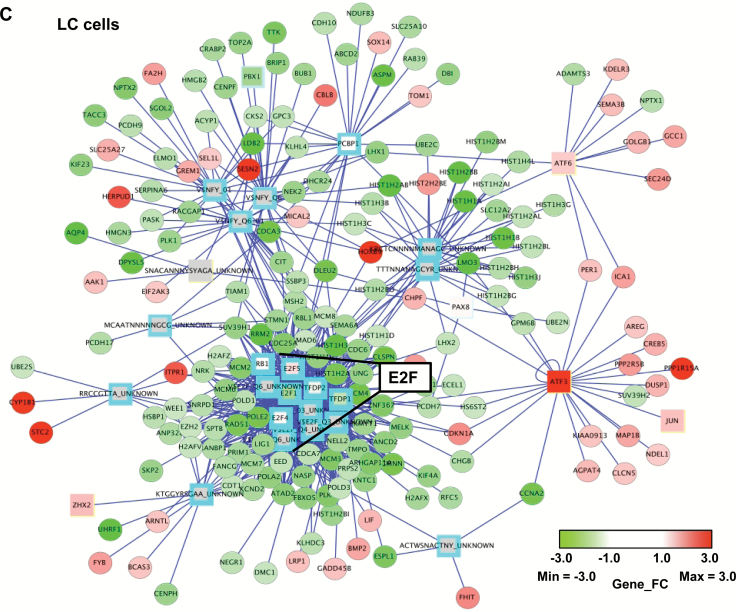
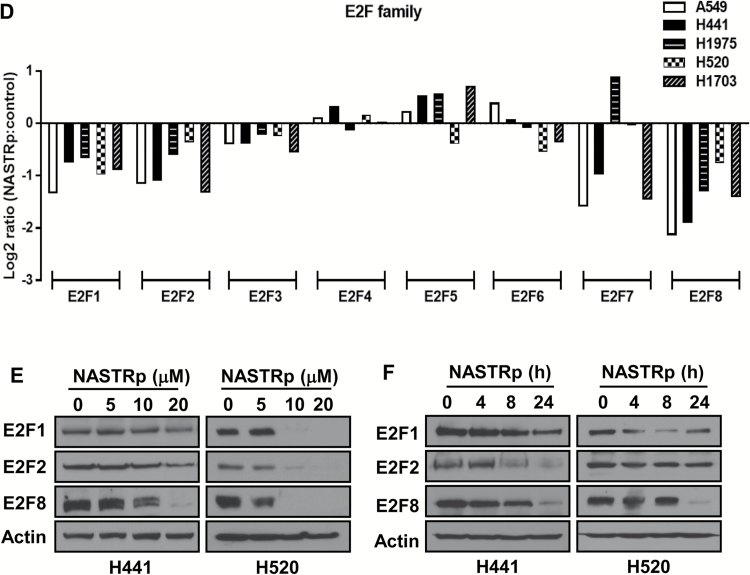
Effects of NASTRp on the E2F-related pathways. A) Chemical structures of NASTRp and NASEp. B) Heatmap of the genes regulated by NASTRp treatment at 10 μM for 24 hours in each indicated lung cancer cell line. Red: upregulated genes, green: downregulated genes. Fold change ≥ 2, P < .05. C) Whole network representing transcription factors and their targets affected by NASTRp. The center of the node for transcription factors (squares) and the whole node for target genes (circles) reflect the fold change in expression from the microarray analysis. Red: upregulated genes, green: downregulated genes, cyan border: negative enrichment in the transcription factor targets, yellow (SNACANNNYSYAGA_UNKNOWN, ZHX2, ATF6, ATF3, and JUN): positive enrichment. FC = fold change. D) Effect of NASTRp-mediated expression changes in each E2F family member in five lung cancer cell lines. Y-axis = ratio of expression values (Log 2) of NASTRp-treated vs vehicle-treated cells. X-axis = the individual genes in each cell line. E-F) Expression of E2F1, E2F2, and E2F8 by NASTRp treatment in (E) a dose-dependent (0, 5, 10, or 20 μM; 48 hours) and (F) a time-dependent manner (0, 4, 8, or 24 hours; 20 μM) in H441 and H520 cells. LC = lung cancer.


