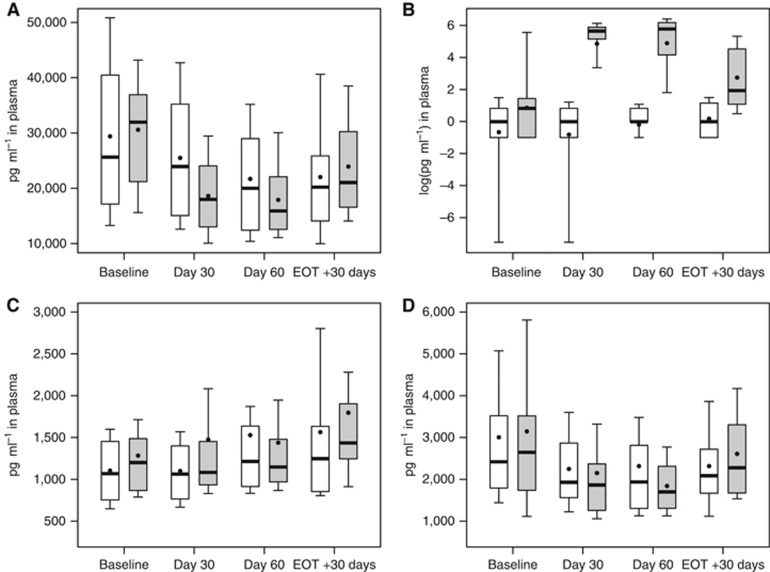
Figure 2.
Plasma levels of sVEGFR3 (A), PlGF (B), HGF (C) and ANGPT2 (D). Concentrations are displayed for mFOLFOX6-treated (White) and mFOLFOX6/Aflibercept-treated (grey) patients at baseline, 30 days after the first study treatment infusion, 60 days after first infusion and 30 days after last infusion. Plasma levels for PlGF are log-transformed to allow visualisation of low levels of PlGF.

