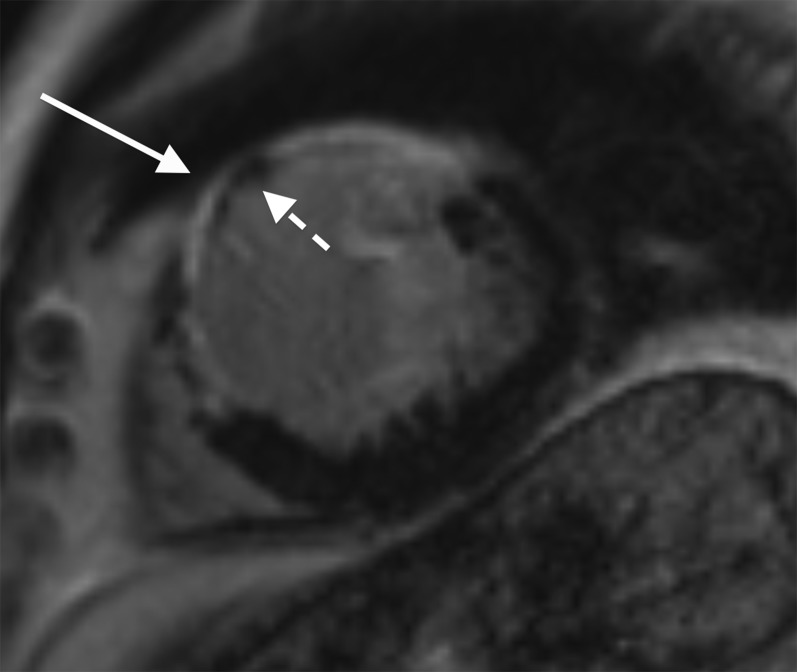
Figure 8.
Short axis late gadolinium enhancement sequence acquired at the mid left ventricular level showing a full thickness infarct involving the anterior and anteroseptal left ventricular wall (white arrow). Areas of low signal within the myocardium at the site of infarct (interrupted arrow) corresponded with foci of calcification seen on a previous CT in keeping with a calcified myocardial infarct. Note that unlike patients with microvascular obstruction, the myocardium is significantly thinned in patients with a long-standing calcified infarct.

