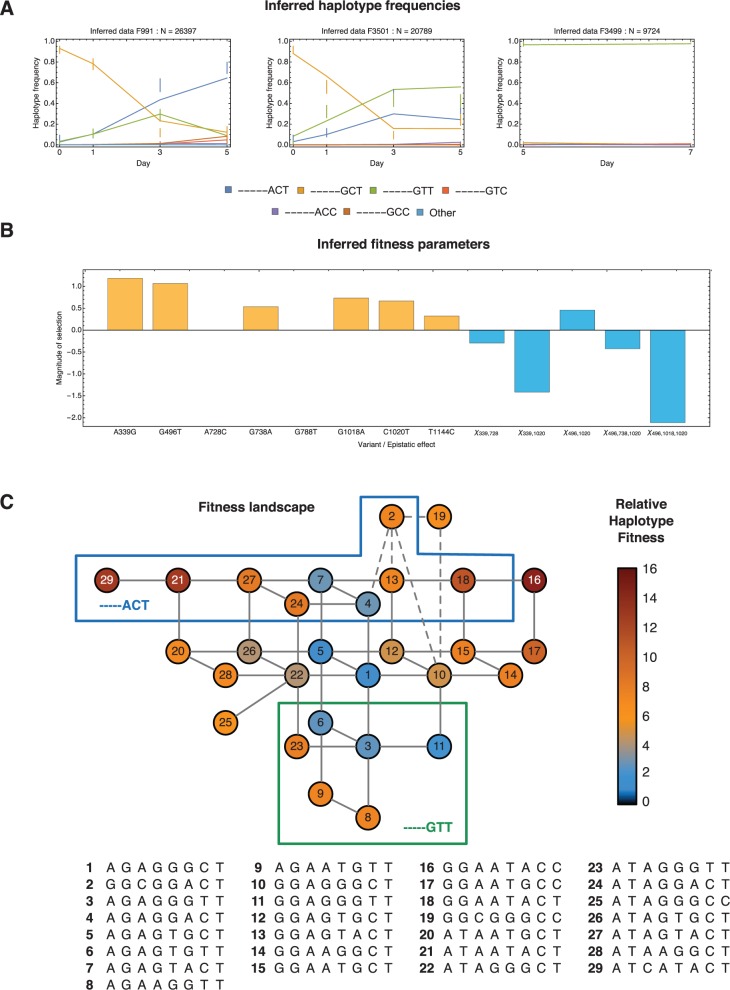
Fig. 3.
Inferences made for experiment 1. (A) Observed and inferred partial haplotype frequencies. Haplotype frequencies from reads spanning the final three loci of interest are shown as vertical bars. Bars are centered on the observed frequency and extend one standard deviation either side of this, according to the inferred model of noise in the data. Inferred haplotype frequencies are shown as solid lines. (B) Inferred selection coefficients (yellow) and epistatic interactions (blue) given the default mutation rate μ = 10−5. (C) Inferred fitness landscape. Solid lines between numbered haplotypes indicate single mutations. Dotted lines indicate haplotypes separated by two mutations. Inferred fitness is indicated by color. Only haplotypes that were inferred to comprise 1% or more of the population in some animal at some time point are shown.

