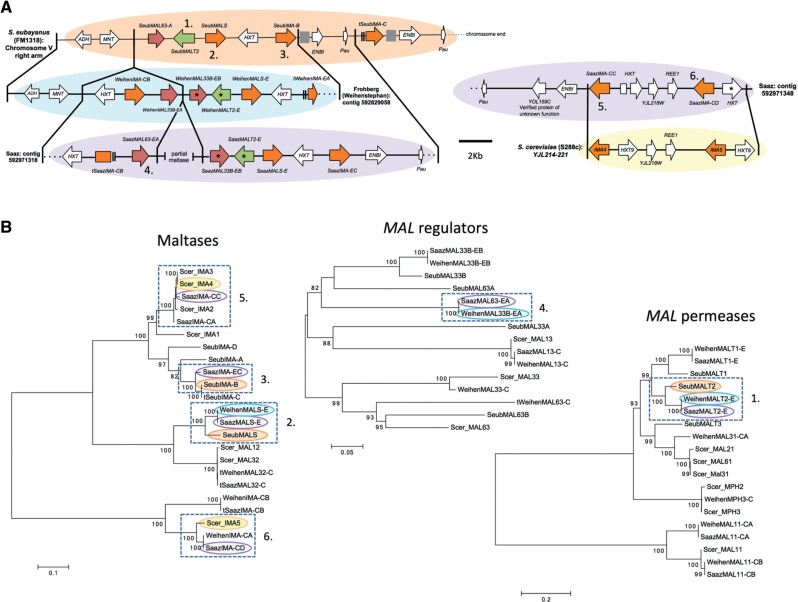
Fig. 4.
Synteny and phylogenetic analysis of MAL genes from Saccharomyces eubayanus (FM1318), S. cerevisiae (S288c), and the Saaz (CBS 1513) and Frohberg (W34/70) lineages of lager-brewing yeasts. Numbers in (A) and (B) indicate genes whose orthology is supported both by synteny and phylogenetic analysis. (A) Solid lines connecting genomes designate blocks of synteny. Chromosome and contig locations are indicated to the left or right of genome segments. The location of the S. cerevisiae segment is indicated by the systematic names of the genes within the syntenic region. Asterisks indicate genes with complete sequences but putatively inactivating mutations. The inactivated Saaz HXT in the region syntenic to S. cerevisiae is divided into two due to an insertion within the gene. Genes are colored as in figure 3. Gene sizes and distances are approximately to scale. Arrows show the directions of transcription. Gray boxes represent gaps in the sequence. Double lines before or after a gene represent incomplete sequence due to poor resolution in those areas, and their names are marked with a “t” for truncated. Dotted lines represent the end of a chromosome or contig. (B) Maximum likelihood trees for maltases, regulators of MAL genes, and maltose permeases (transporters) based on nucleotide sequences. Branch lengths are based on the number of substitutions per site. Bootstrap support values of 70 or higher are shown at nodes. Genes present in the synteny analysis are highlighted by an oval of the same color as their genome blocks in (A). Dashed boxes indicate groups of genes whose ortholog is also supported by synteny. More details on these genes can be found in supplementary table S2, Supplementary Material online.

