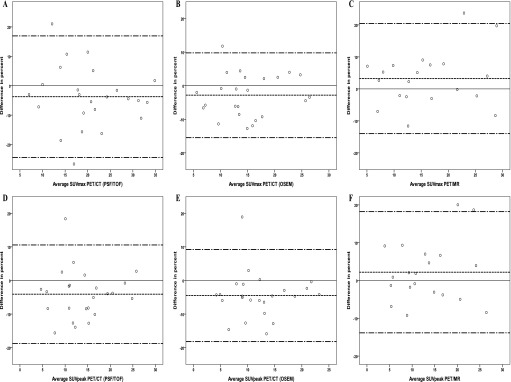
Figure 2.
Bland–Altman plots of the maximum standardized uptake value (SUVmax) and peak standardized uptake value (SUVpeak) for positron emission tomography (PET)/CT reconstructed with point spread function (PSF)/time of flight (TOF) (a, d) and ordered subset expectation maximization (OSEM) (b, e) and for PET/MR (c, f). The difference in percent is plotted against the average; the solid line is reference for no difference, and the dashed lines represent the mean and the upper and lower limits of agreement

