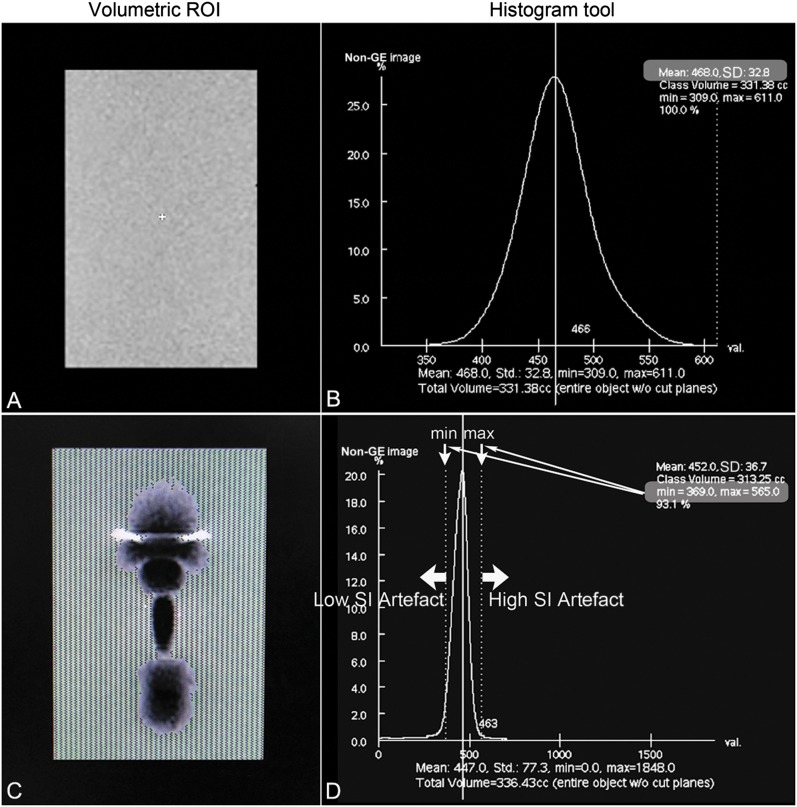
Figure 1.
Schematic illustration of the volumetric measurement of metal artefacts. MR image of blank agarose phantom (a) with associated histogram analysis (b) was performed within the volume of interest. Mean signal intensity (SI) was 468.0 with standard deviation (SD) of 32.8. The normal range of SI was then defined as mean ± 3 SDs for pure agarose gel at the same concentration. When the normal range was applied into the corresponding MR image of the phantom with metallic implant (c) and associated SI histogram (d), all the pixels with SI outside the normal range (lower threshold = 369 and upper threshold = 566) were considered as metal-induced artefacts. The measurement was completed throughout the entire image volume for volumetric calculation of metal artefacts.

