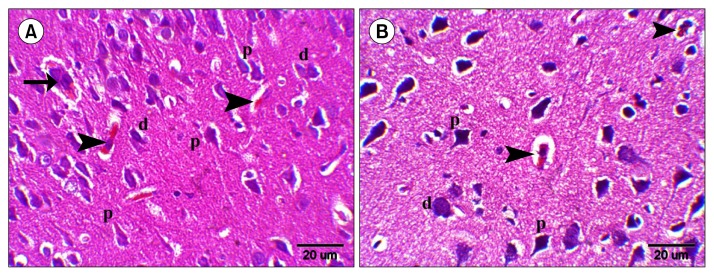
Fig. 3.
H&E (x400): Sections in the rat cerebral cortex in EP layer of (A) Group IV showing a small multinucleated acidophilic mass (arrow), few deformed neurons (d), few neurons exhibiting acidophilic cytoplasm and dark nuclei (arrowheads) and multiple normal pyramidal cells (p). (B) Group V showing two neurons exhibiting acidophilic cytoplasm and dark nucleus (arrowheads), a deformed neuron (d) and multiple normal pyramidal cells (p).

