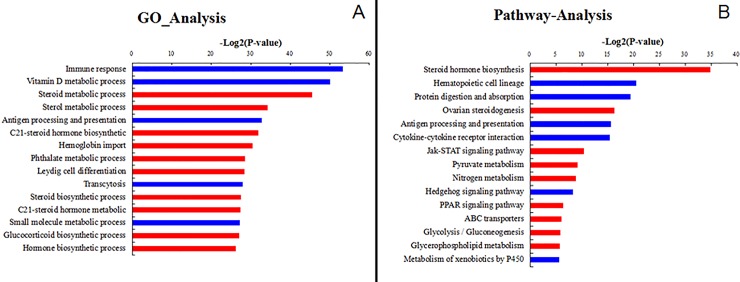
Fig 1. Gene ontology analysis and pathway analysis of all differentially expressed unigenes.
(A) Gene ontology analysis of differentially expressed unigenes. The blue bar indicates up-regulated genes in sterile gonads compared with fertile gonads; the red bar indicates down-regulated genes in sterile gonads compared with sterile gonads. (B) Pathway analysis of all differentially expressed unigenes. The blue bar indicates up-regulated genes in sterile gonads compared with fertile gonads; the red bar indicates down-regulated genes in sterile gonads compared with sterile gonads.

