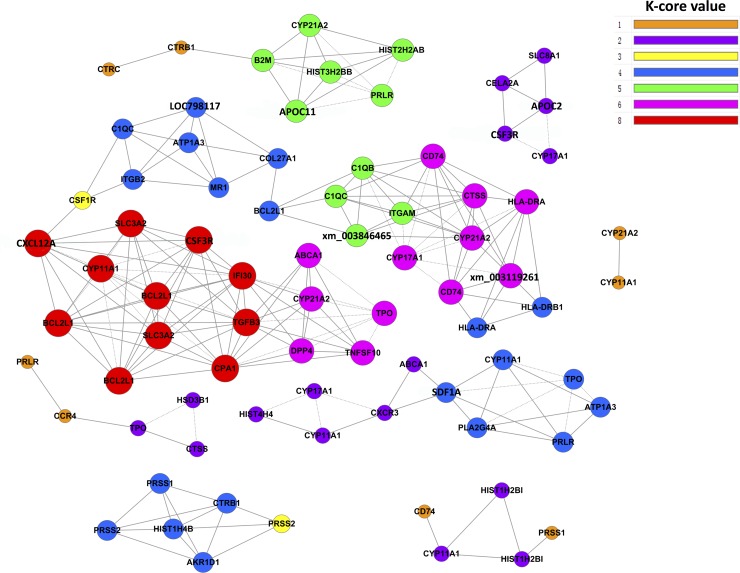
Fig 2. Co-expression network of differentially expressed genes in sterile gonads.
Genes from pathways showing high expression differences were analyzed and identified using a gene co-expression network with a k-core algorithm. Cycle nodes represent genes, and the size of the node represents the power of the interrelationships among nodes; the edges between two nodes represent interactions between genes, and the greater the number of edges associated with a gene, the more it is connected to other genes and the more central is its role within the network.

