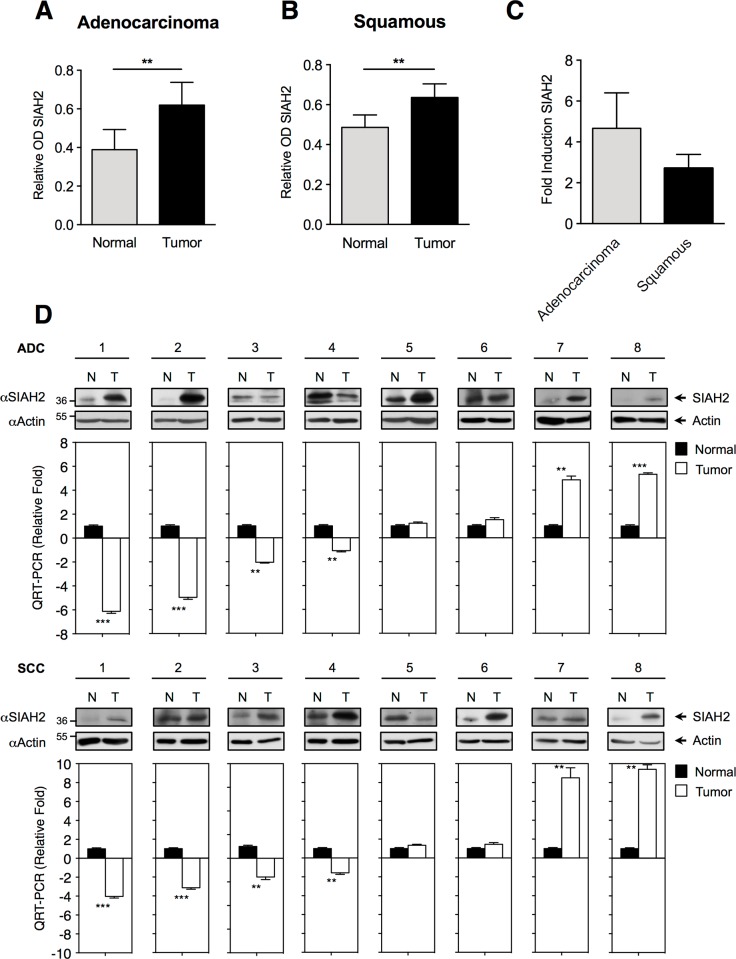
Fig 2. SIAH2 protein expression in human lung cancer compared to surrounding healthy tissue.
(A, B) Total proteins were extracted from ADC or SDC specimens and the corresponding normal lung tissue, SIAH2 protein expression analyzed by western blot and the bands quantified by densitometry after normalization to actin signal intensities. The results are expressed as relative OD expression and represent the mean ± SD. ** p < 0.001. (C) Fold induction representation of SIAH2 in tumor samples compared to normal lung samples from the same patient. Results represent the mean ± SD. (D) Results from 16 patients (8 ADC and 8 SCC) selected to represent a range of differential mRNA expression between normal lung tissue (N) and tumor (T). SIAH2 protein expression was analyzed by immunoblots (upper panel) and mRNA expression by qPCR (lower panel). Data are mean ± SD of n = 3 experiments. ** p < 0.001 and *** p < 0.0001.

