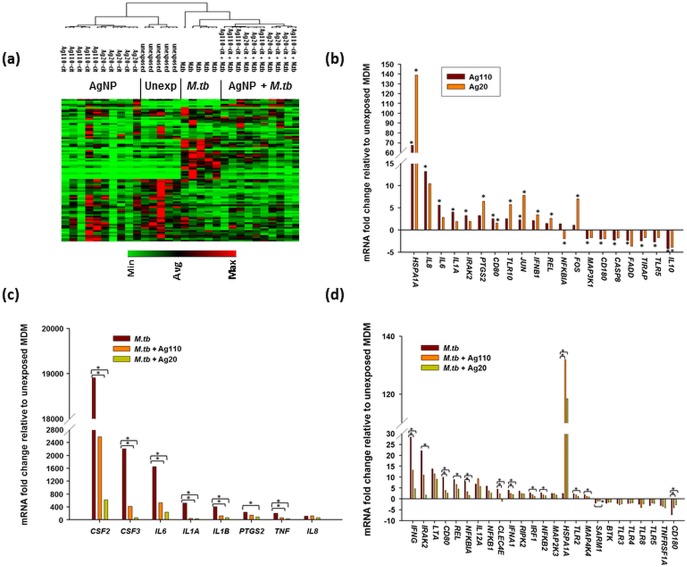
Fig 9. Comparison of AgNP-induced TLR signaling pathway-specific gene expression in MDM in the absence and presence of M.tb.
MDM from five donors were exposed to Ag20-citrate ± M.tb, Ag110-citrate ± M.tb, M.tb, or left unexposed for 4 hours at 37°C in a humidified 5% CO2 environment followed by RNA extraction. The final concentration of AgNP was 10 μg/mL and M.tb was used at a MOI 10. RNA was analyzed by TLR pathway specific RT2 profiler arrays (Cat. No. PAHS 018E, Qiagen Sciences, MD) [28]. Levels of cDNA were calculated with the relative quantitation method (ΔΔCt method) from the PCR array data using analysis software accessed from http://sabiosciences.com/pcrarraydataanalysis.php. Statistical differences in fold-mRNA expression levels between AgNP-exposed and unexposed and uninfected cells were calculated using the same software. (a) Non-supervised clustering of the entire dataset showing the overall pattern of expression of 84 genes across 30 MDM samples from five human subjects with each row and column representing a gene and samples, respectively. A dendrogram including all 30 samples are shown. (b) Mean fold-changes (≥ 2-fold) of mRNA from MDM exposed to 10 μg/mL of Ag20-citrate or Ag110-citrate relative to unexposed MDM are shown. Statistically significant changes (p < 0.05) relative to AgNP-unexposed MDM are marked by an asterisk (*). (c) and (d) M.tb-induced alteration of mRNA expression with mean fold-changes ≥2-fold and p≤0.05 relative to uninfected MDM were compared with that from MDM treated with M.tb + Ag20-citrate or M.tb + Ag110-citrate. Panel c shows mRNA fold-changes induced by M.tb alone that are ≥ 100-fold and panel d shows mRNA fold-changes induced by M.tb alone that are < 100-fold. Statistically significant changes (p < 0.05) relative to M.tb-induced expression are marked by an asterisk (*).

