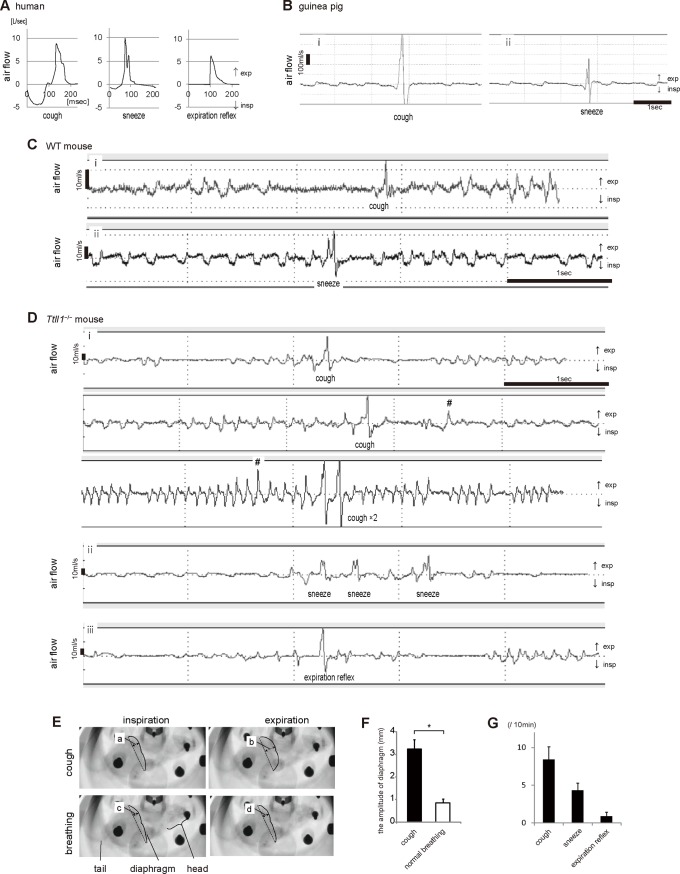
Fig 1. Respiratory reflexes in humans, guinea pigs, wild-type (WT) mice, and Ttll1 −/− mice.
(A−D): Charts exhibiting airflow patterns of respiratory reflexes. Expiratory flow is indicated by the plus sign (upward) and inspiratory flow is indicated by the minus sign (downward). Airflow patterns of human reflexes (A). Airflow through the nose and mouth induced by cough, sneeze, and the expiration reflex was recorded using a spirometer (n = 3). Cough and the expiration reflex were evoked by inhaled capsaicin. Sneeze was evoked by mechanical stimuli applied by rubbing the nasal cavity with a tapered tissue paper. Airflow patterns of reflexes in guinea pigs (B) and WT mice (C; see S1–S4 Videos). Airflows of cough and sneeze were analyzed using a whole body plethysmograph (WBP). Cough was evoked by inhaled citric acid in guinea pigs and capsaicin in mice. Sneeze was induced by intranasal instillation of ovalbumin in sensitized animals. In (A–C), cough and sneeze showed one-peak and two-peak expiration patterns with preceding inspiration, respectively. Airflow patterns of reflexes in Ttll1 −/− mice (D; see S5–S7 Videos). These reflexes were analyzed by WBP and classified into three patterns: (i) one-peak expiration with preceding inspiration, (ii) two-peak expiration with preceding inspiration, and (iii) one-peak expiration without preceding inspiration. Patterns (i) and (ii) corresponded to cough and sneeze patterns, respectively. #: expiration during eupneic breathing, which was not accompanied by characteristic sound and motion. (E) Representative photos recorded by videofluoroscopy. The Ttll1 −/− mice were placed in a WBP device. Inspiration and expiration phases in cough and normal breathing are shown. Solid lines indicate the diaphragm of the Ttll1 −/− mice (see S8 Video). (F) The bar graph shows the calculated amplitude of the diaphragm while coughing [= b–a in (E)] and normal breathing [= d–c in (E)]. The maximal distance [two-headed arrow in (E)] between the dotted line connecting the costophrenic angles and the diaphragm [solid line in (E)] as measured during inspiration and expiration while coughing and normal breathing. Diaphragm motion in the Ttll1 −/− mice was larger during coughing than during normal breathing (n = 3; mean ± SEM; *P = 0.006 by two-tailed Student's t-test). (G) Number of respiratory reflexes of the Ttll1 −/− mice in ten minutes (mean ± SEM, n = 10).

