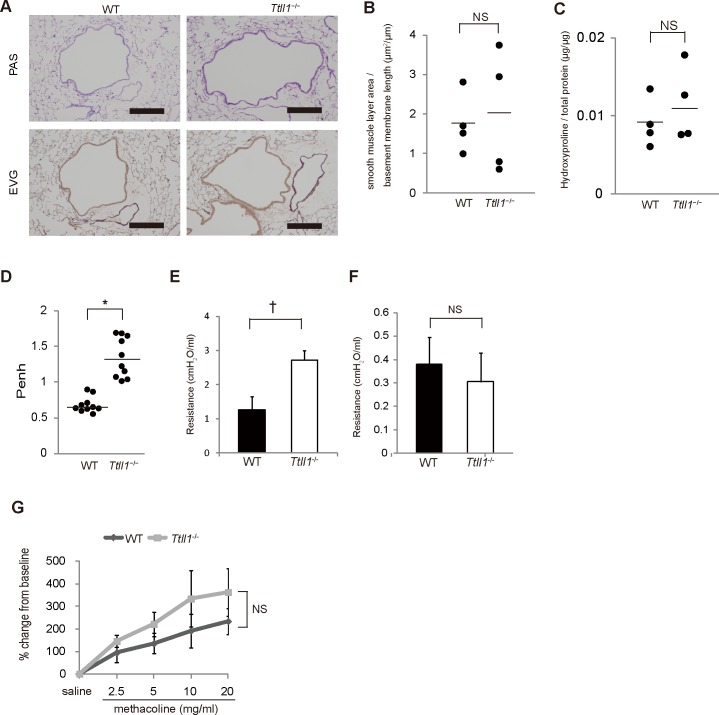
Fig 4. Increased upper airway resistance without airway remodeling in Ttll1 −/− mice.
(A) Lung sections stained with periodic acid-Schiff (PAS) and elastic van Gieson's (EVG) stains. There were no apparent differences between the wild-type (WT) and Ttll1 −/− mice (n = 4 per group). Scale bar, 200 μm. (B) Measurement of smooth muscle area. To adjust airway size, the area of the smooth muscle layer was divided by the length of the basement membrane (bars indicate mean values, n = 4 per group, two-tailed Student's t test; NS = not significant). (C) Measurements of hydroxyproline in lung homogenates. Right lower lung homogenates used for the hydroxyproline assay (bars indicate mean values, n = 4 per group, two-tailed Student's t test) (D). The baseline enhanced pause (Penh) indices of mice (bars indicate mean values, n = 10 mice per group, * P < 0.0001 by two-tailed Student's t-test). (E and F) The flexiVent system was used to measure upper (E) and lower (F) airway resistance in the anesthetized and intubated mice. The upper airway resistance was increased, but lower airway resistance was not increased in the Ttll1 −/− mice compared with that in the WT mice (mean ± SEM, n = 4 mice per group, † P < 0.05 by two-tailed Student's t-test). (G) Assessment of airway hyperresponsiveness (AHP). The mice were exposed to nebulized saline and methacholine (2.5, 5, 10, 20 mg/ml), and airway resistance was measured in each nebulization. There was no difference in AHP to methacholine (mean ± SEM, n = 4 mice per group, two-tailed Student's t-test; NS = not significant).

