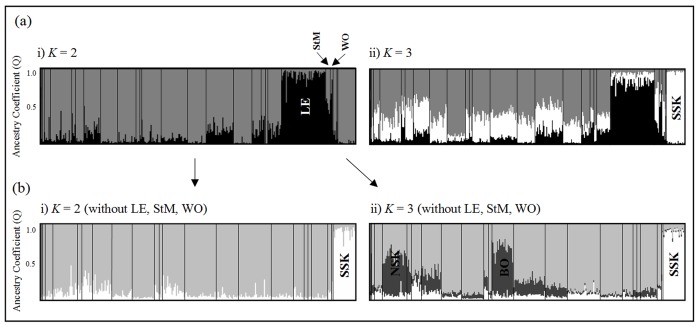
Fig 2. Individual assignment to K clusters based on the Bayesian clustering program, STRUCTURE.
Inferred population structure of the black-capped chickadee (Poecile atricapillus) from 12 microsatellite loci. Runs were conducted for two values of K, but the optimal number of clusters to describe the data was unclear. The initial run (a) for all individuals from 28 localities resulted in contrasting values of true K: (i) K = 2 (ΔK) and ii) K = 3 (LnPr (X|K)). After choosing K = 2 as the true value, we removed the genetic cluster containing LE, StM and WO and did a second run (b) which produced contrasting results: (i) K = 2 (ΔK) and ii) K = 3 (LnPr (X|K)). Due to mixed assignment of NSK and BO at K = 3, we chose K = 2 as the true value. No additional structure was identified after removing population SSK. Overall, STRUCTURE identified three genetic clusters (cluster 1: LE, StM and WO; cluster 2: SSK and cluster 3: all remaining populations).

