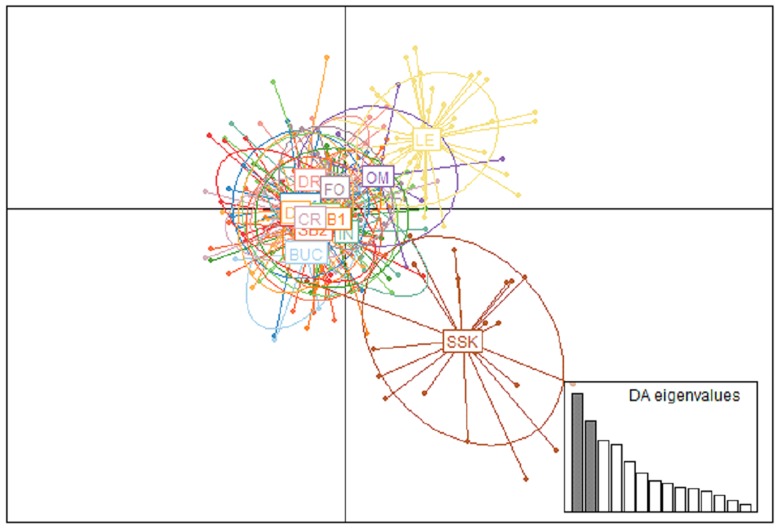
Fig 4. Genetic similarity inferred by discriminant analysis of principal components (DAPC).
A representation of genetic relatedness between geographical clusters of black-capped chickadee populations (N = 15) obtained by DAPC. The graphs represent individuals as dots and the populations as inertia ellipses (population abbreviations can be found in Table 1) and scatterplots are based on the first two principal components. Populations with N ≤ 5 were excluded.

