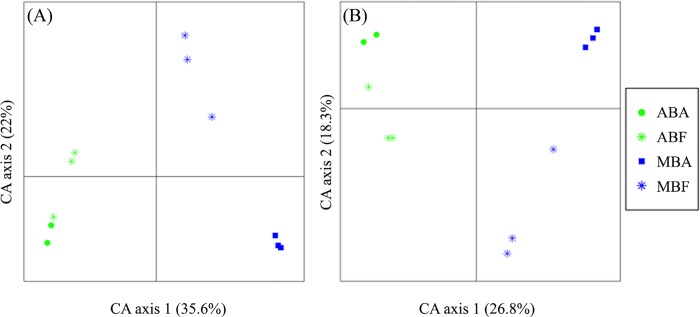
Fig 1. Correspondence analysis (CA) plot generated from the whole non cyanobacterial OTUs obtained with Eub-Pr1 (A) and NC-Pr2 (B) primer set, showing the distribution of the bacterial community after normalization to the smallest sample (n = 786 reads).
(AB) for Anabaena bloom, (MB) for Microcystis bloom and (F) for free living fraction and (A) for the associated fraction.

