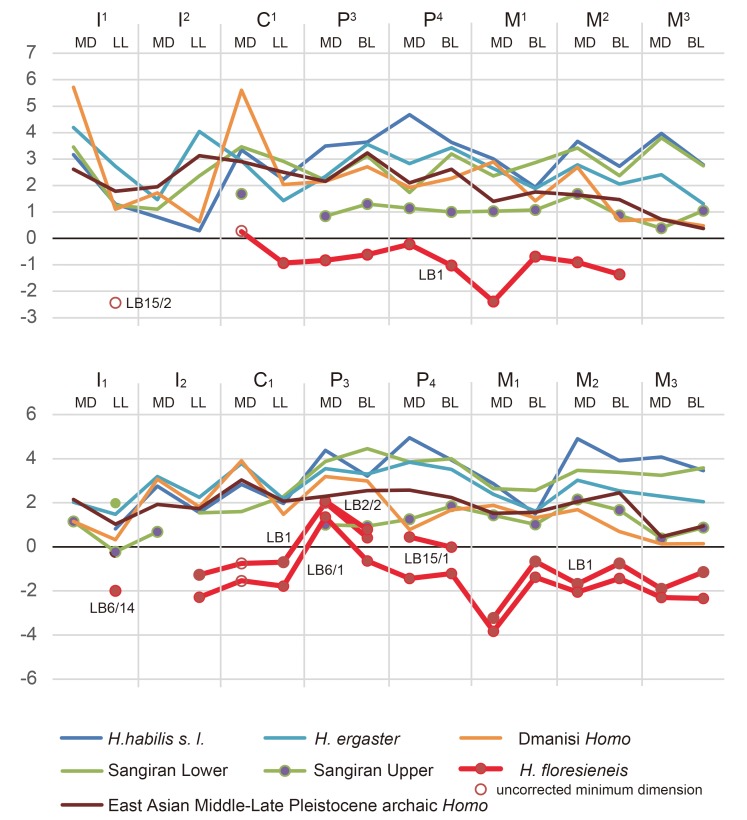
Fig 2. Z-scores for the tooth crown length (MD) and breadth (LL or BL) for H. floresiensis and other fossil Homo groups as compared to the global H. sapiens sample.
Z-scores are relative deviations from the H. sapiens means in units of standard deviation. Note that the Dmanisi Homo sample here is based on the two smaller individuals. Due to sever tooth wear the largest individual (D4500/2600) l was excluded [27].

