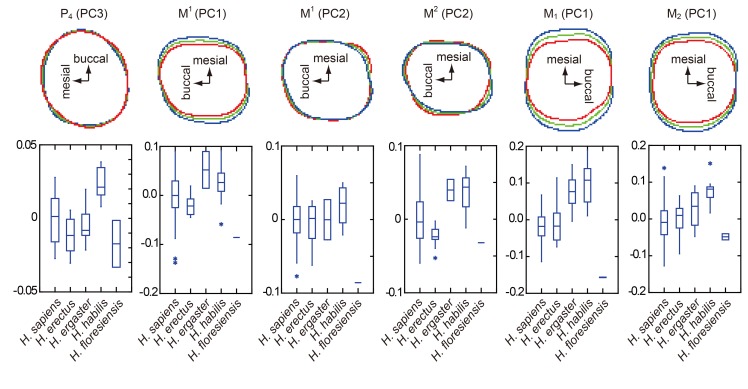
Fig 8. Six PCs showing significant differences in crown contours between H. habilis and early Javanese H. erectus.
The positive and negative are reversed from Figs 4, 5 and 6 in PC3 for P4, PC1 for M1, and PC1 for M1, for the sake of unanimity in the directions of variation. See Figs 4, 5 and 6 for component loading for each PC. The shape variation reflected by each PC is shown in the upper row. Blue and red lines indicate contours of +2 SD and −2 SD of the entire sample, respectively. The green line is the grand mean. In all of these six cases, the contours of H. floresiensis are close to the red outlines, and those of H. habilis to blue outlines. Box plots of the PC scores are shown in the lower row. Note that H. habilis plots far from H. floresiensis whereas early Javanese H. erectus is closer to H. floresiensis in all these PCs.

