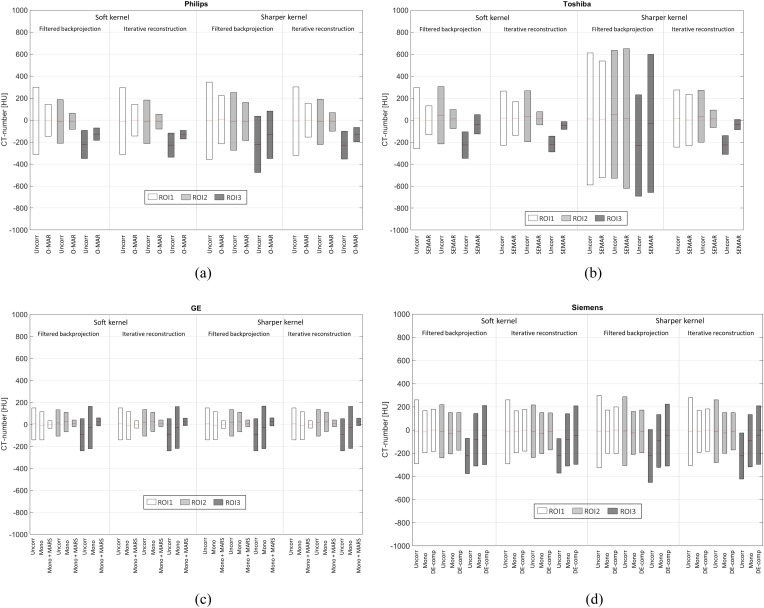
Figure 3.
(a–d) Mean value and the noise (standard deviation) of the CT numbers in the regions of interest (ROIs) (marked in Figure 2), for the phantom scanned with CTs from the four vendors: Philips Healthcare (Cleveland, OH) (a), Toshiba Medical Systems (Otawara, Japan) (b), GE Healthcare (Milwaukee, WI) (c), and Siemens Healthcare (Forchheim, Germany) (d). The standard deviation values are marked by grey areas (white for ROI1, lighter grey for ROI2 and darker grey for ROI3). In each box the mean values are marked by solid lines. The values are shown for the different reconstruction settings; soft/sharper kernel and filtered backprojection/iterative reconstruction. For CT scanner and scan parameter details, see Table 1. DE-comp, DE-composition; MARS, metal artefact reduction software; mono, monoenergetic reconstruction; O-MAR, metal artefact reduction for orthopaedic implants; SEMAR, single-energy metal artefact reduction; Uncorr, uncorrected.

